building a tool that makes causal inference feel like a conversation, not a statistics exam
Synth is a research web application built for social scientists, policy analysts, and economists who need to measure whether an intervention — a law, a program, a reform — actually changed anything. It wraps a rigorous statistical method called synthetic control analysis in an interface that feels more like a guided conversation than a statistics package.
Imagine you're studying whether a new minimum wage policy reduced poverty in a particular state. The only way to be certain would be to show the policy to some states and hide it from identical ones — a controlled experiment. In the real world, that's impossible. You can't un-enact a law for a control group.
To know if a policy worked, you need to compare what happened to what would have happened without the policy. But "what would have happened" is by definition unobservable. You need to construct it.
The synthetic control method builds a weighted combination of similar units — other states, countries, or regions — to construct a plausible "what if." The gap between reality and the synthetic version is the estimated effect of the intervention.
The access problem: Running a synthetic control analysis requires the Synth package in R — a statistical environment with a steep learning curve. Policy researchers who are domain experts, not programmers, were locked out of a method designed precisely for their questions.
When you can see the synthetic control plotted alongside the real data, the method becomes intuitive. The counterfactual isn't an abstract statistical concept anymore — it's a line on a chart, and the story is immediately legible.
Design principle: Don't explain the method in the interface. Let the output explain itself. If researchers understand what they're looking at, the tool disappears.
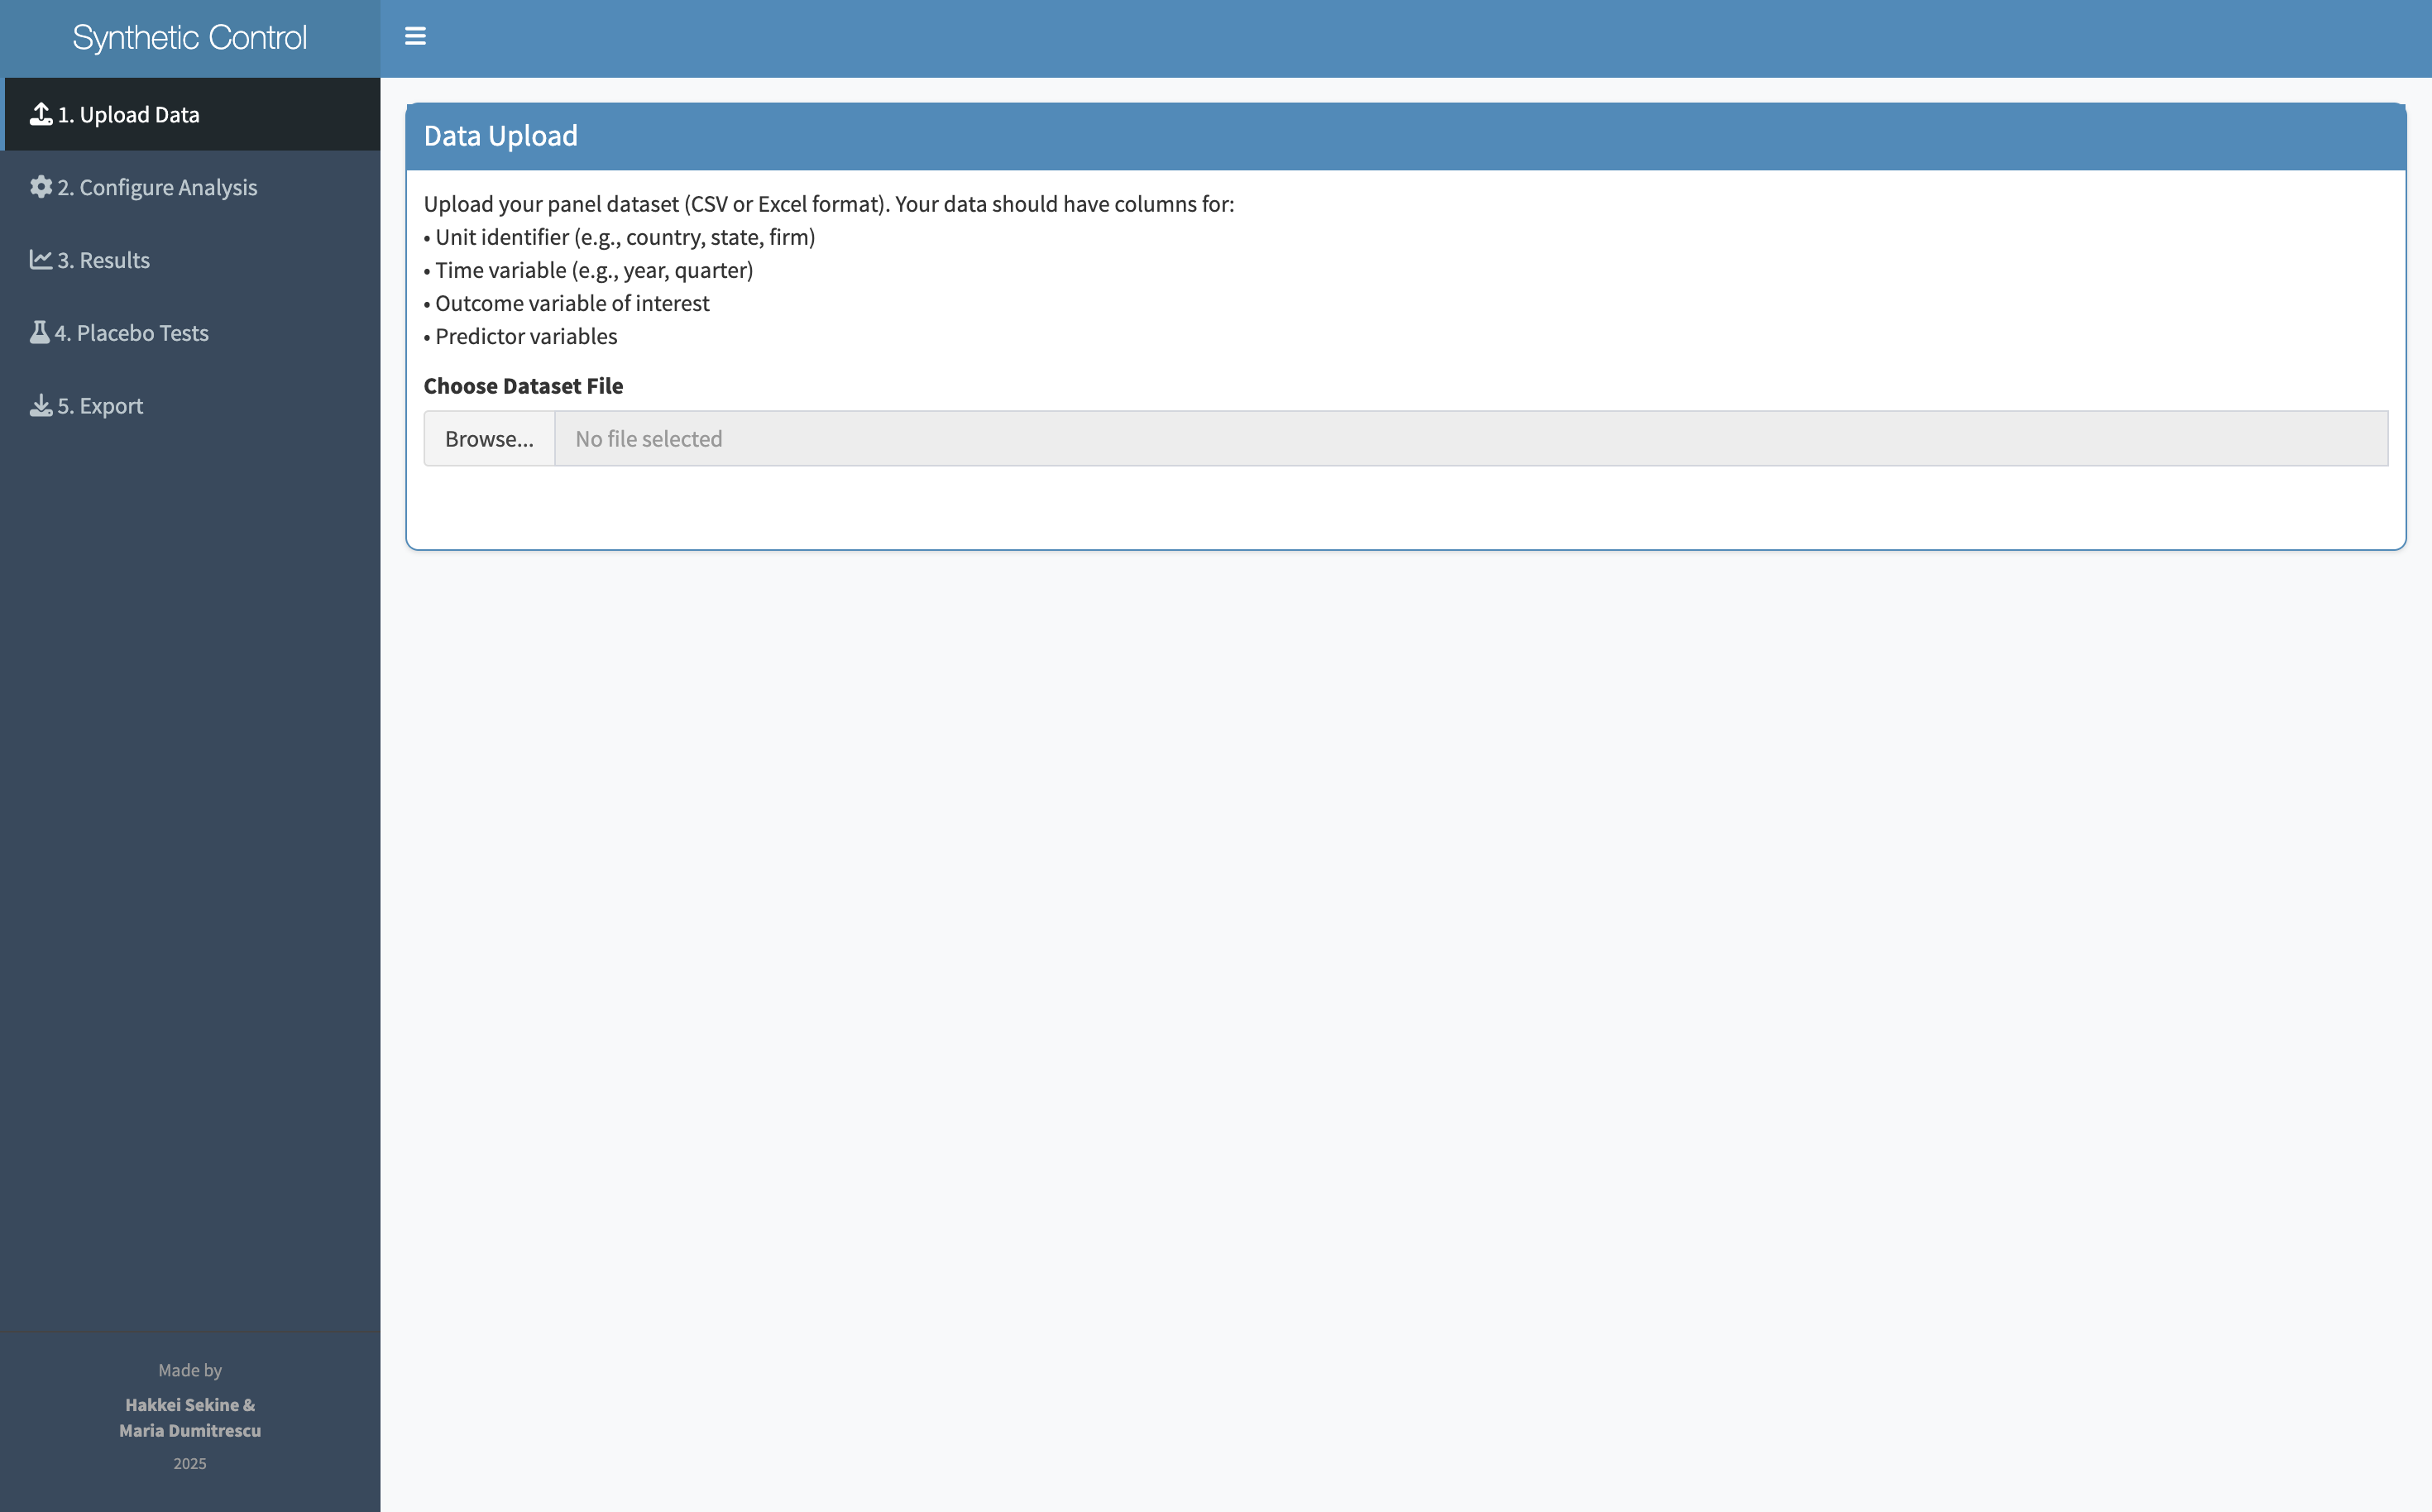
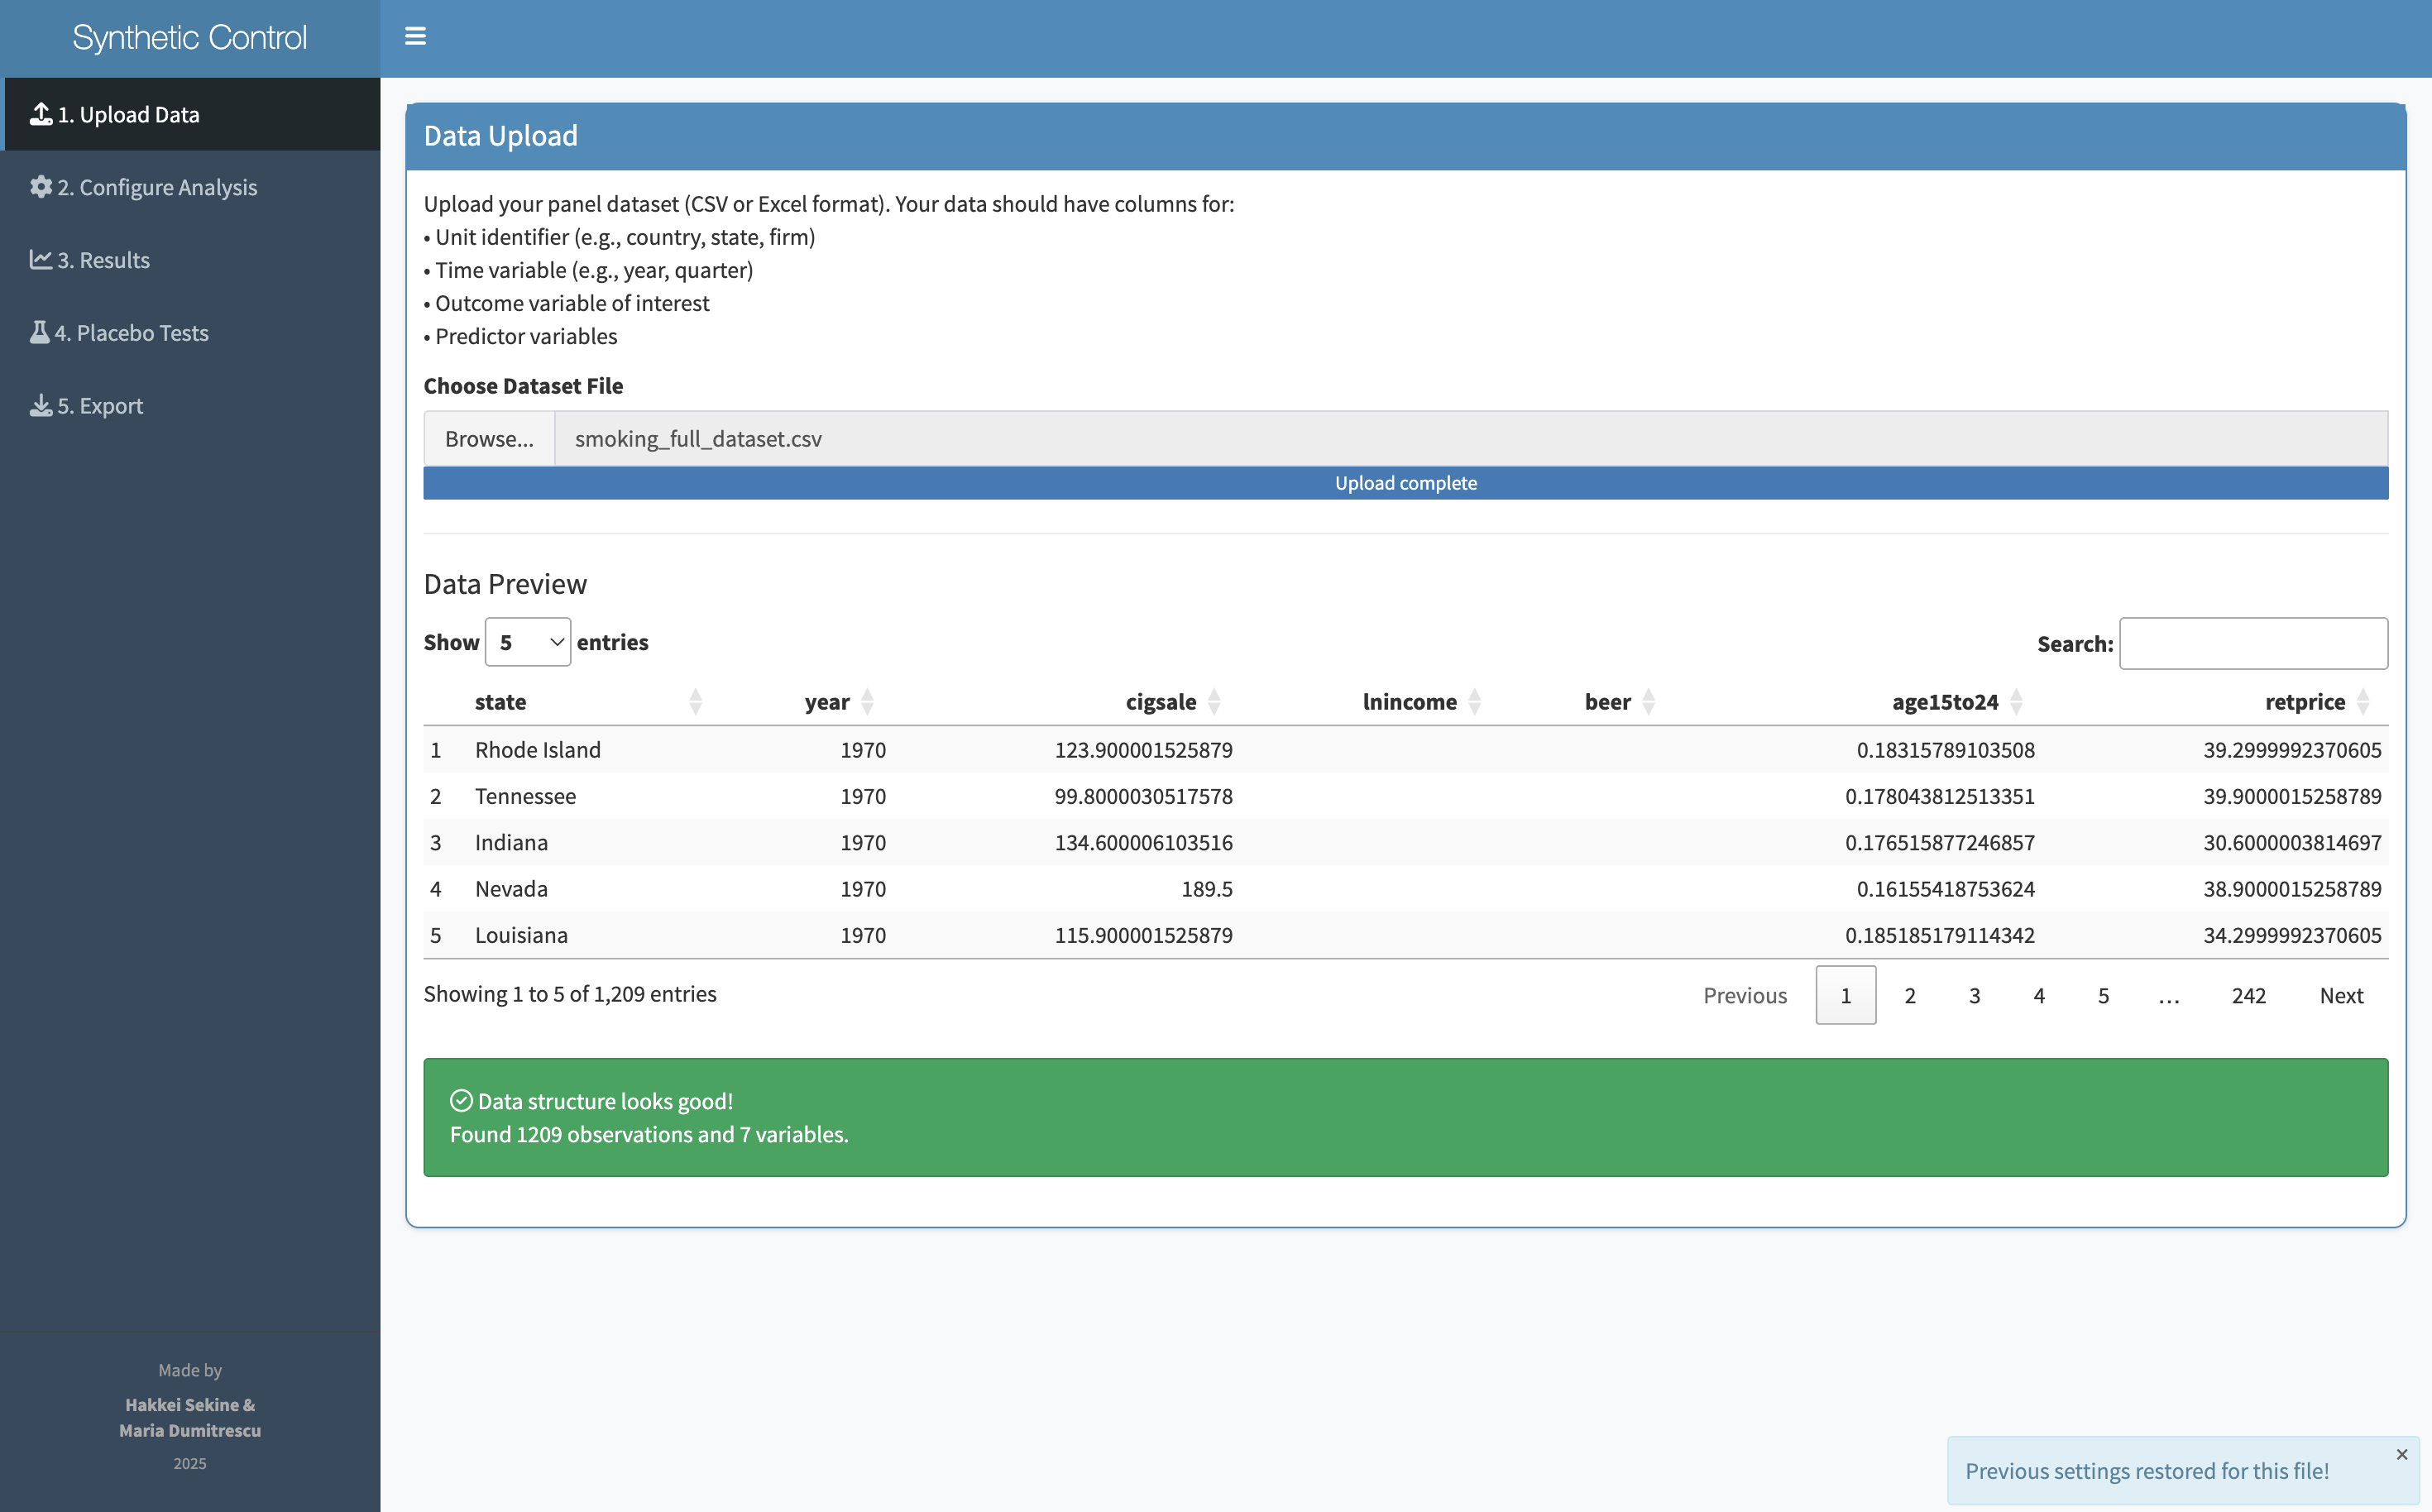
Synth is a Shiny web application — meaning it runs in a browser, no installation required. A researcher uploads their panel data and walks through six steps: upload, review, configure, analyze, validate with placebo tests, and export. Every decision has a default. Every input is a dropdown or a slider, not a function call.
Drop in panel data
Confirm columns & types
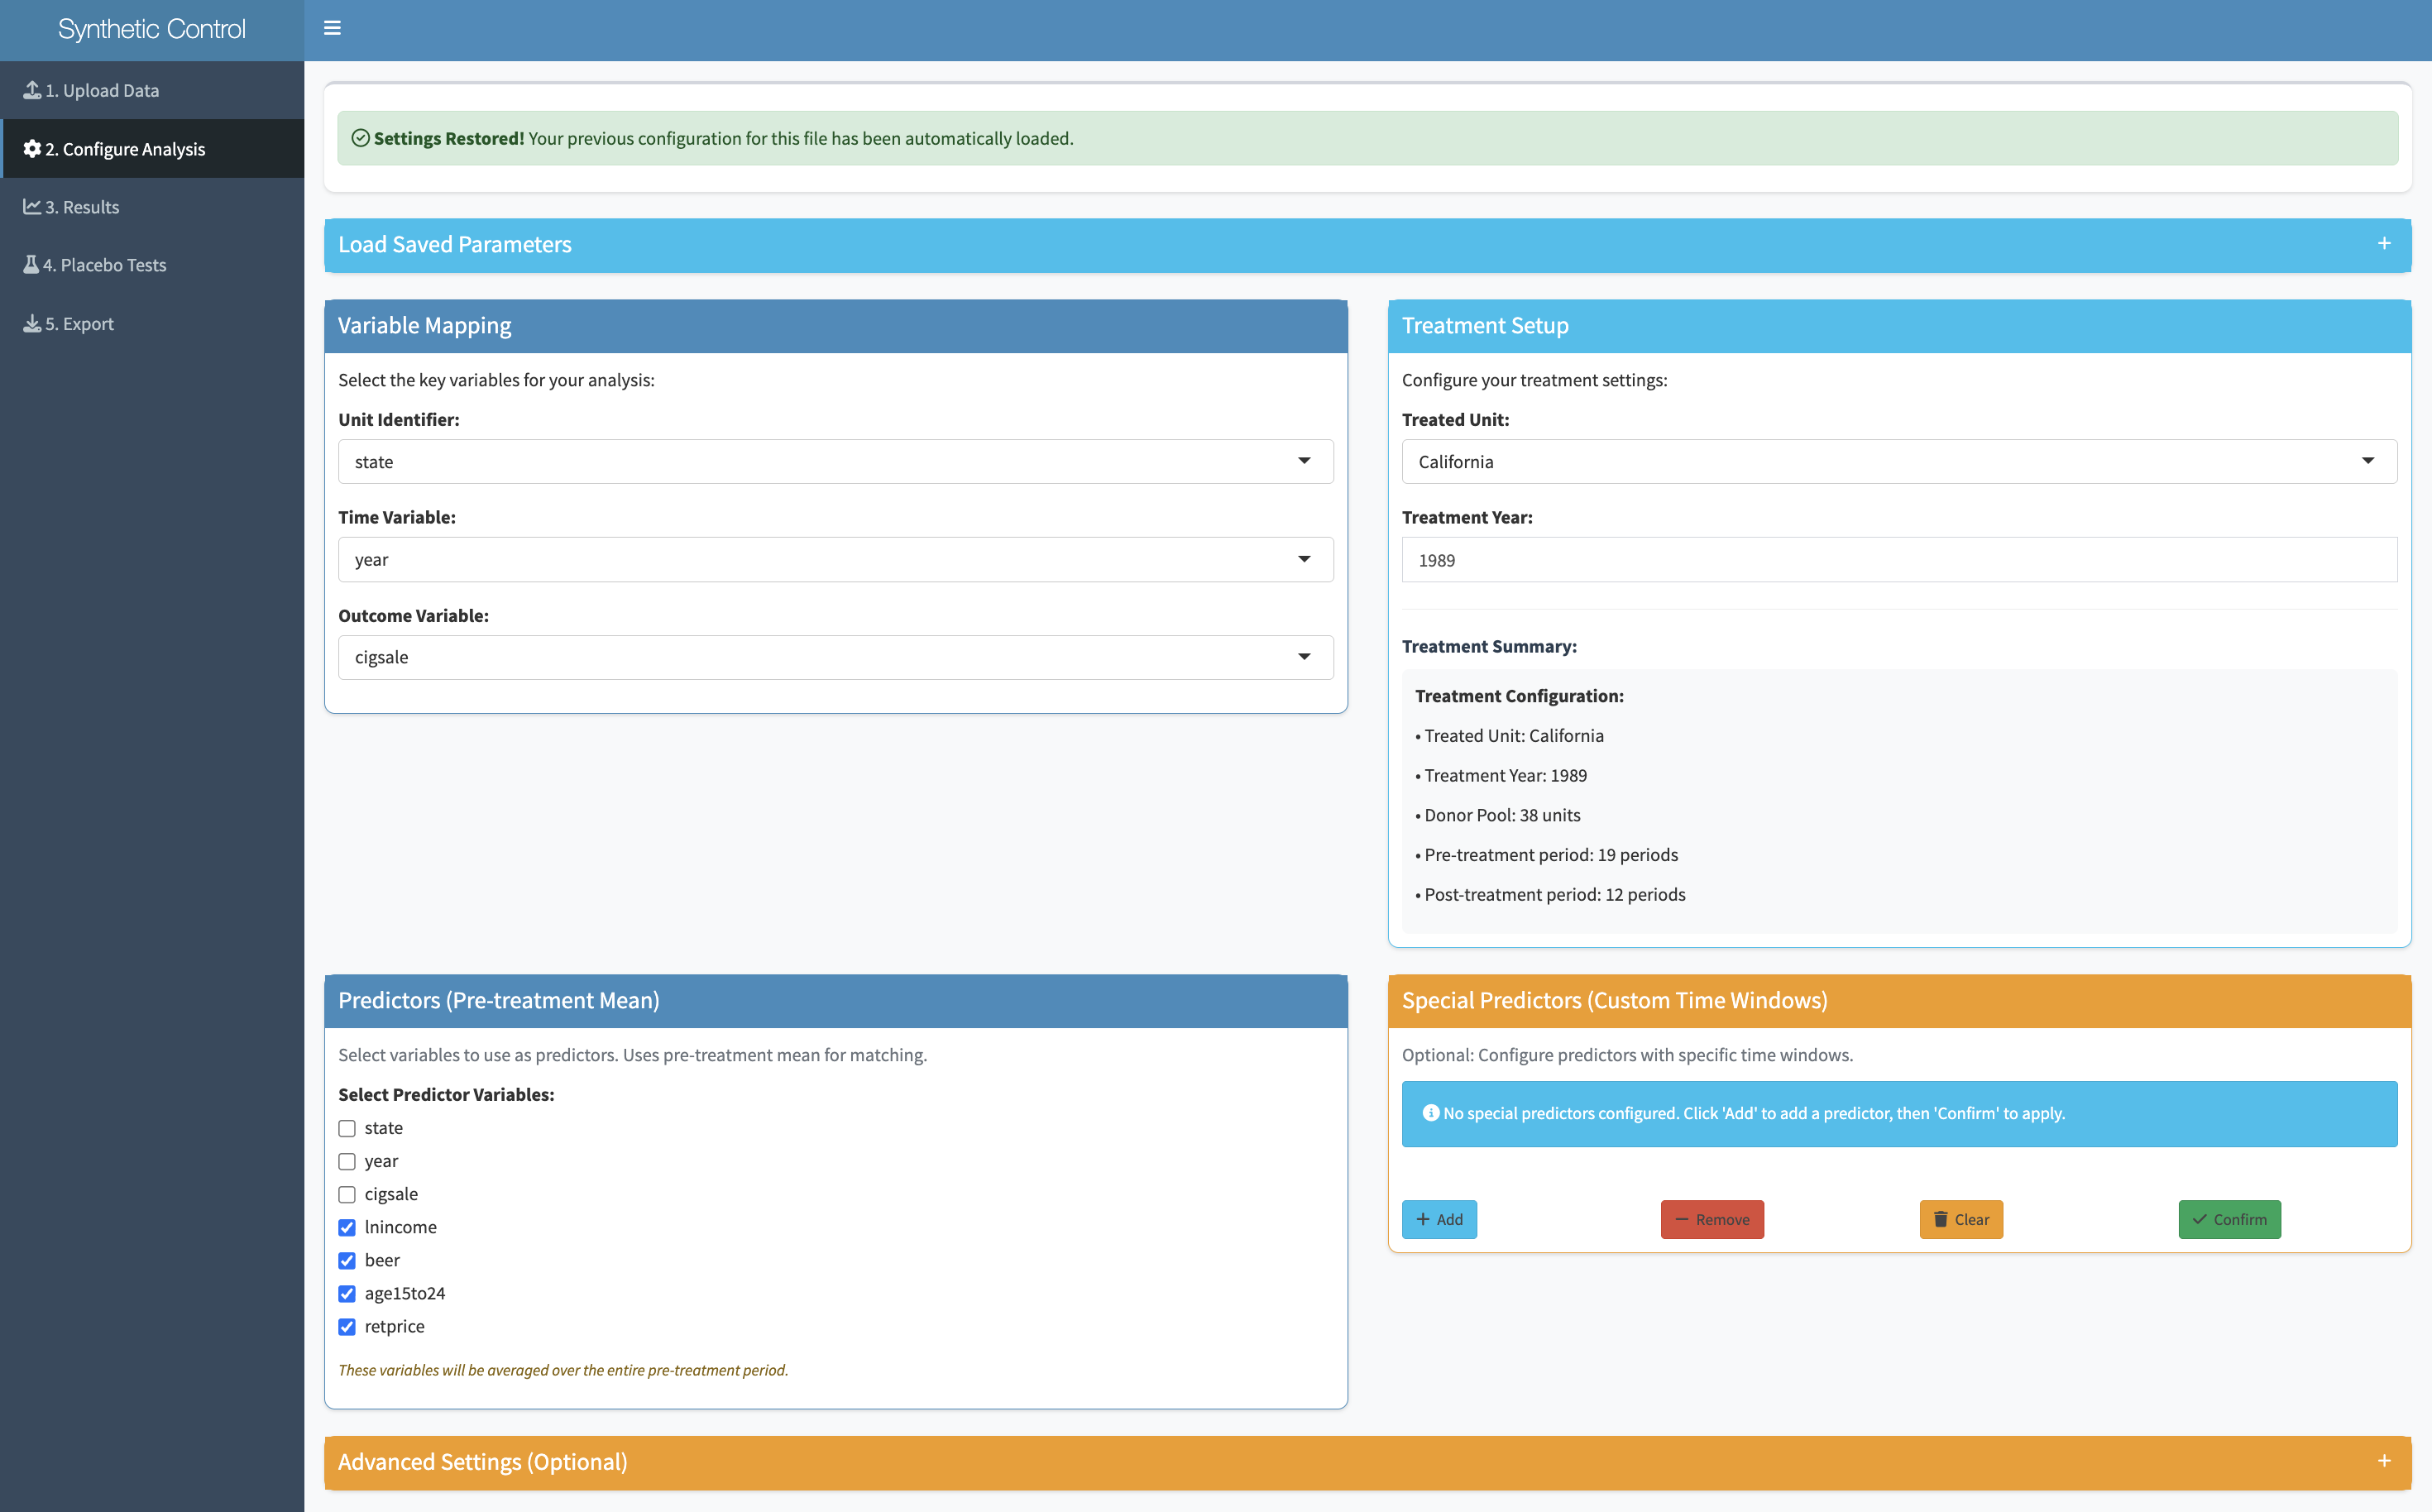
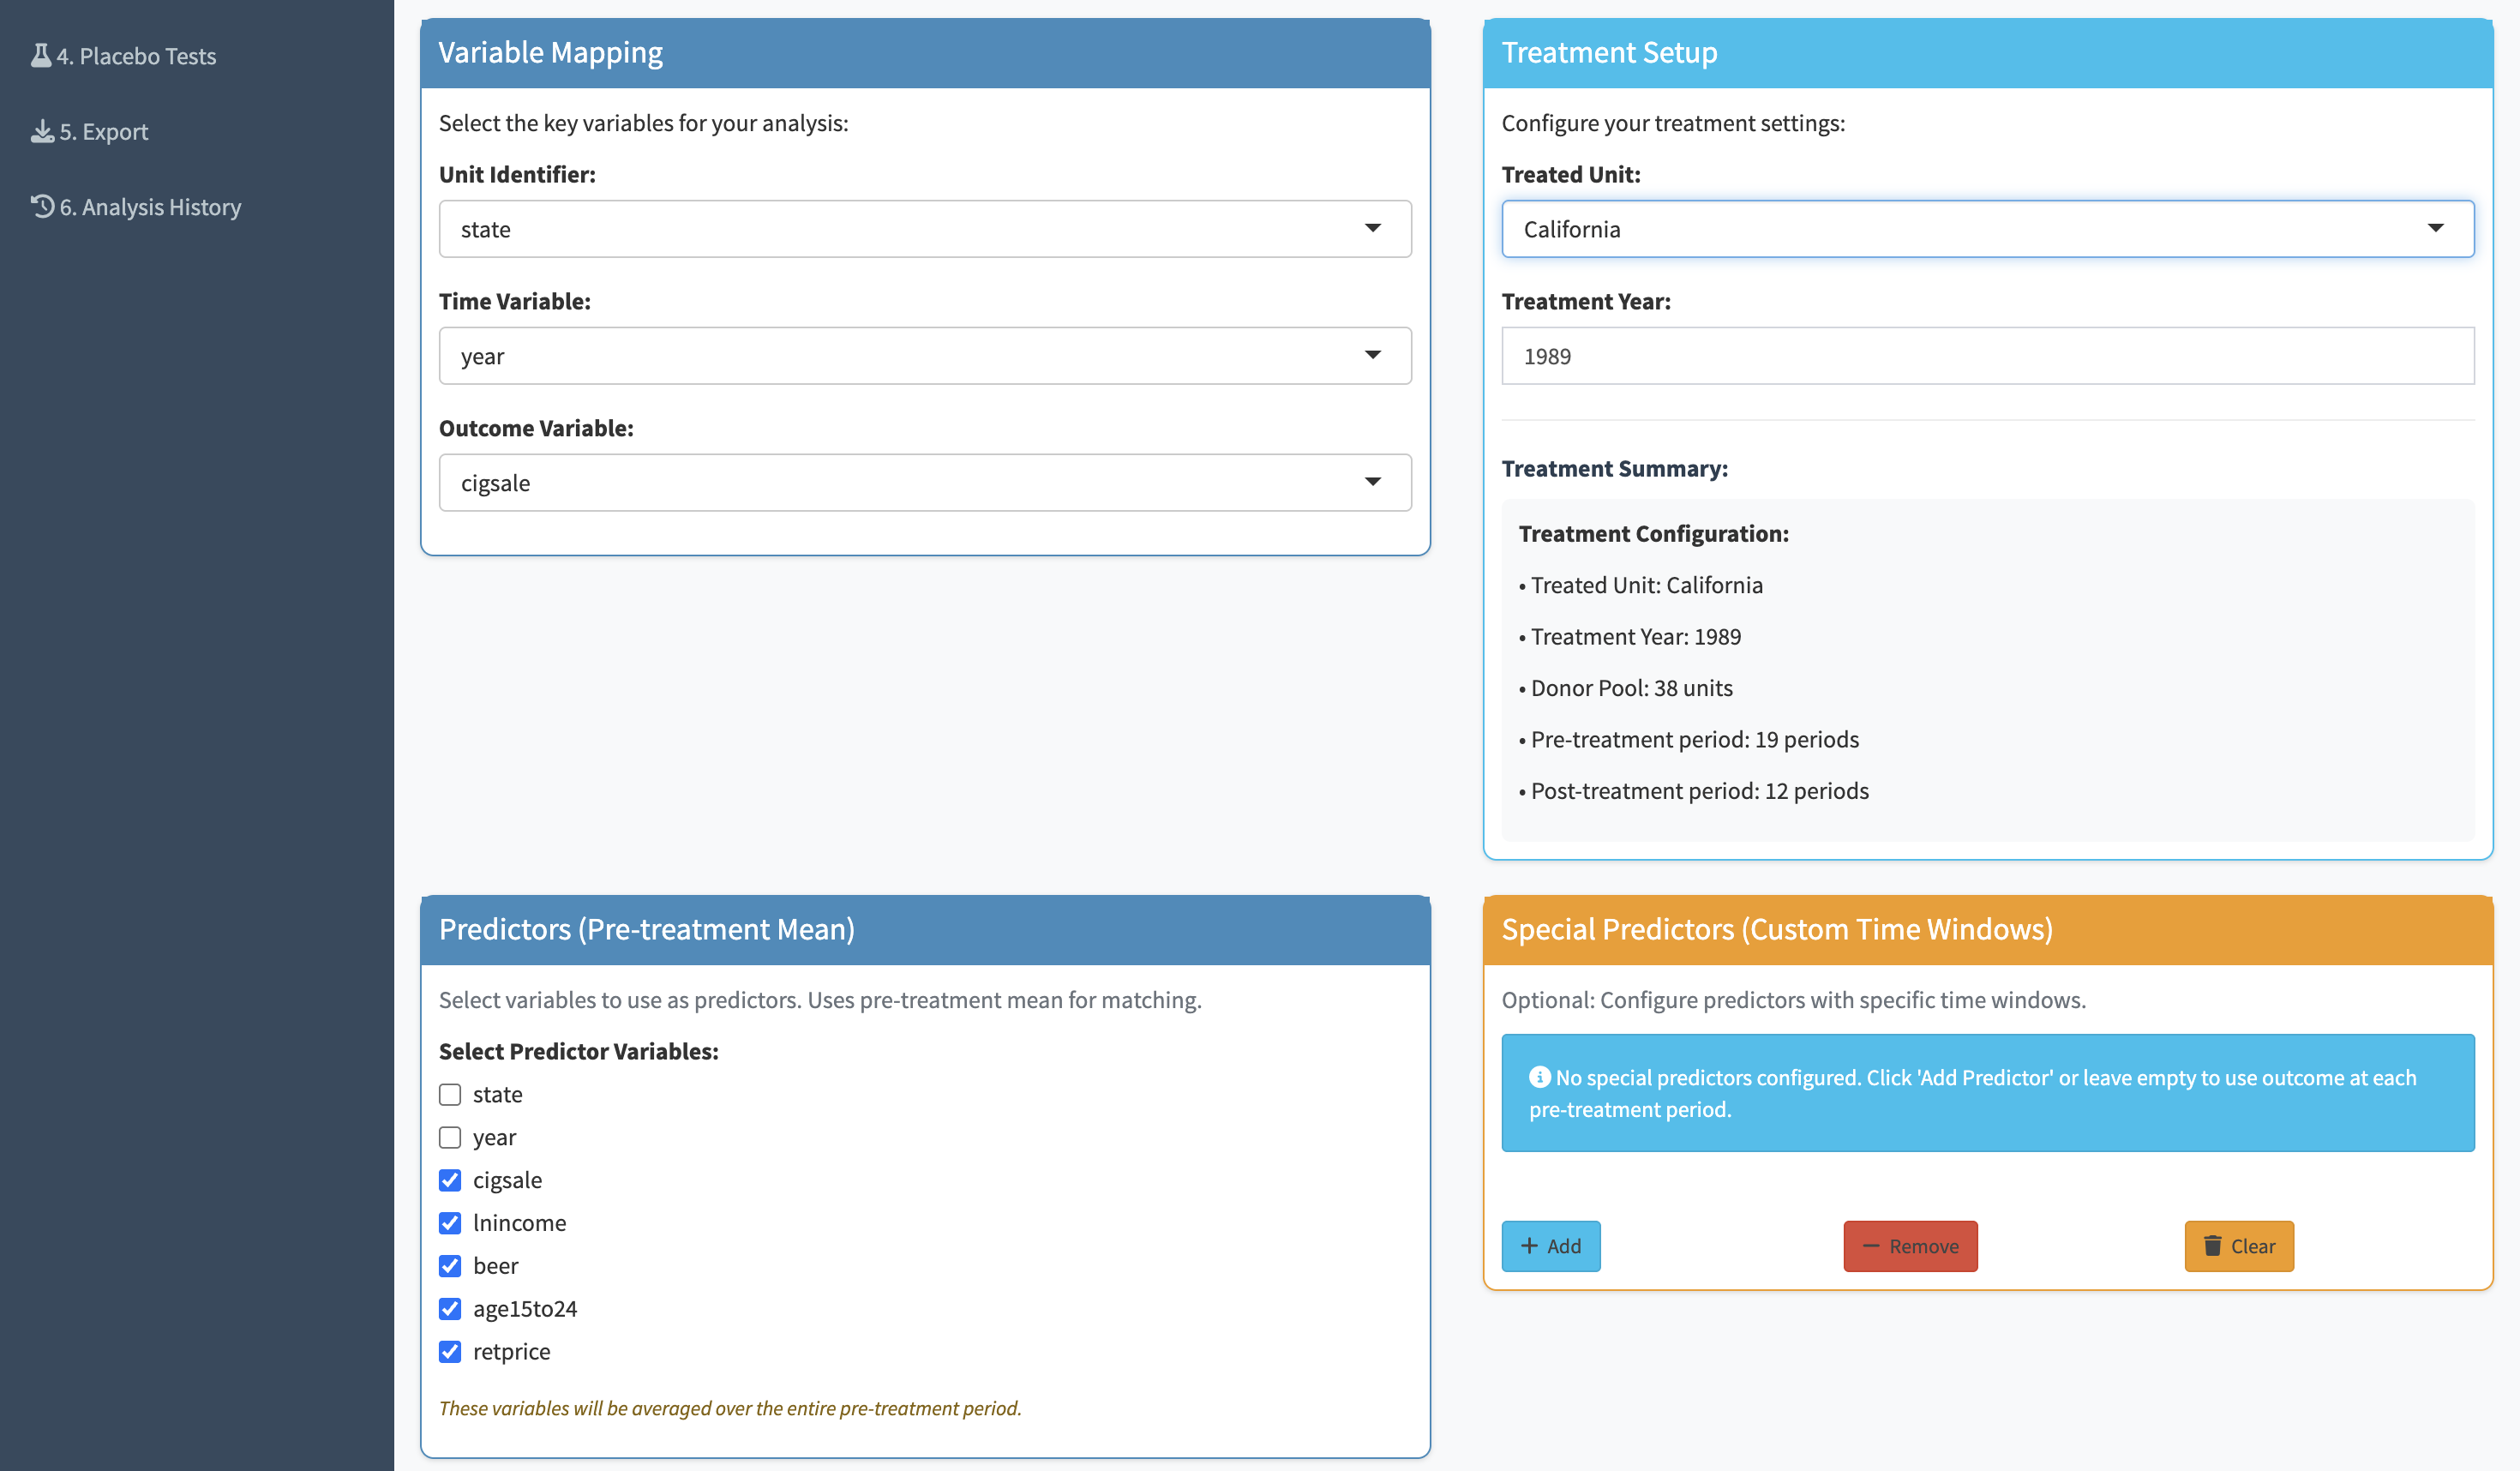
Set unit, time, outcome
Run the synthetic control
Placebo tests in-app
Save results & weights
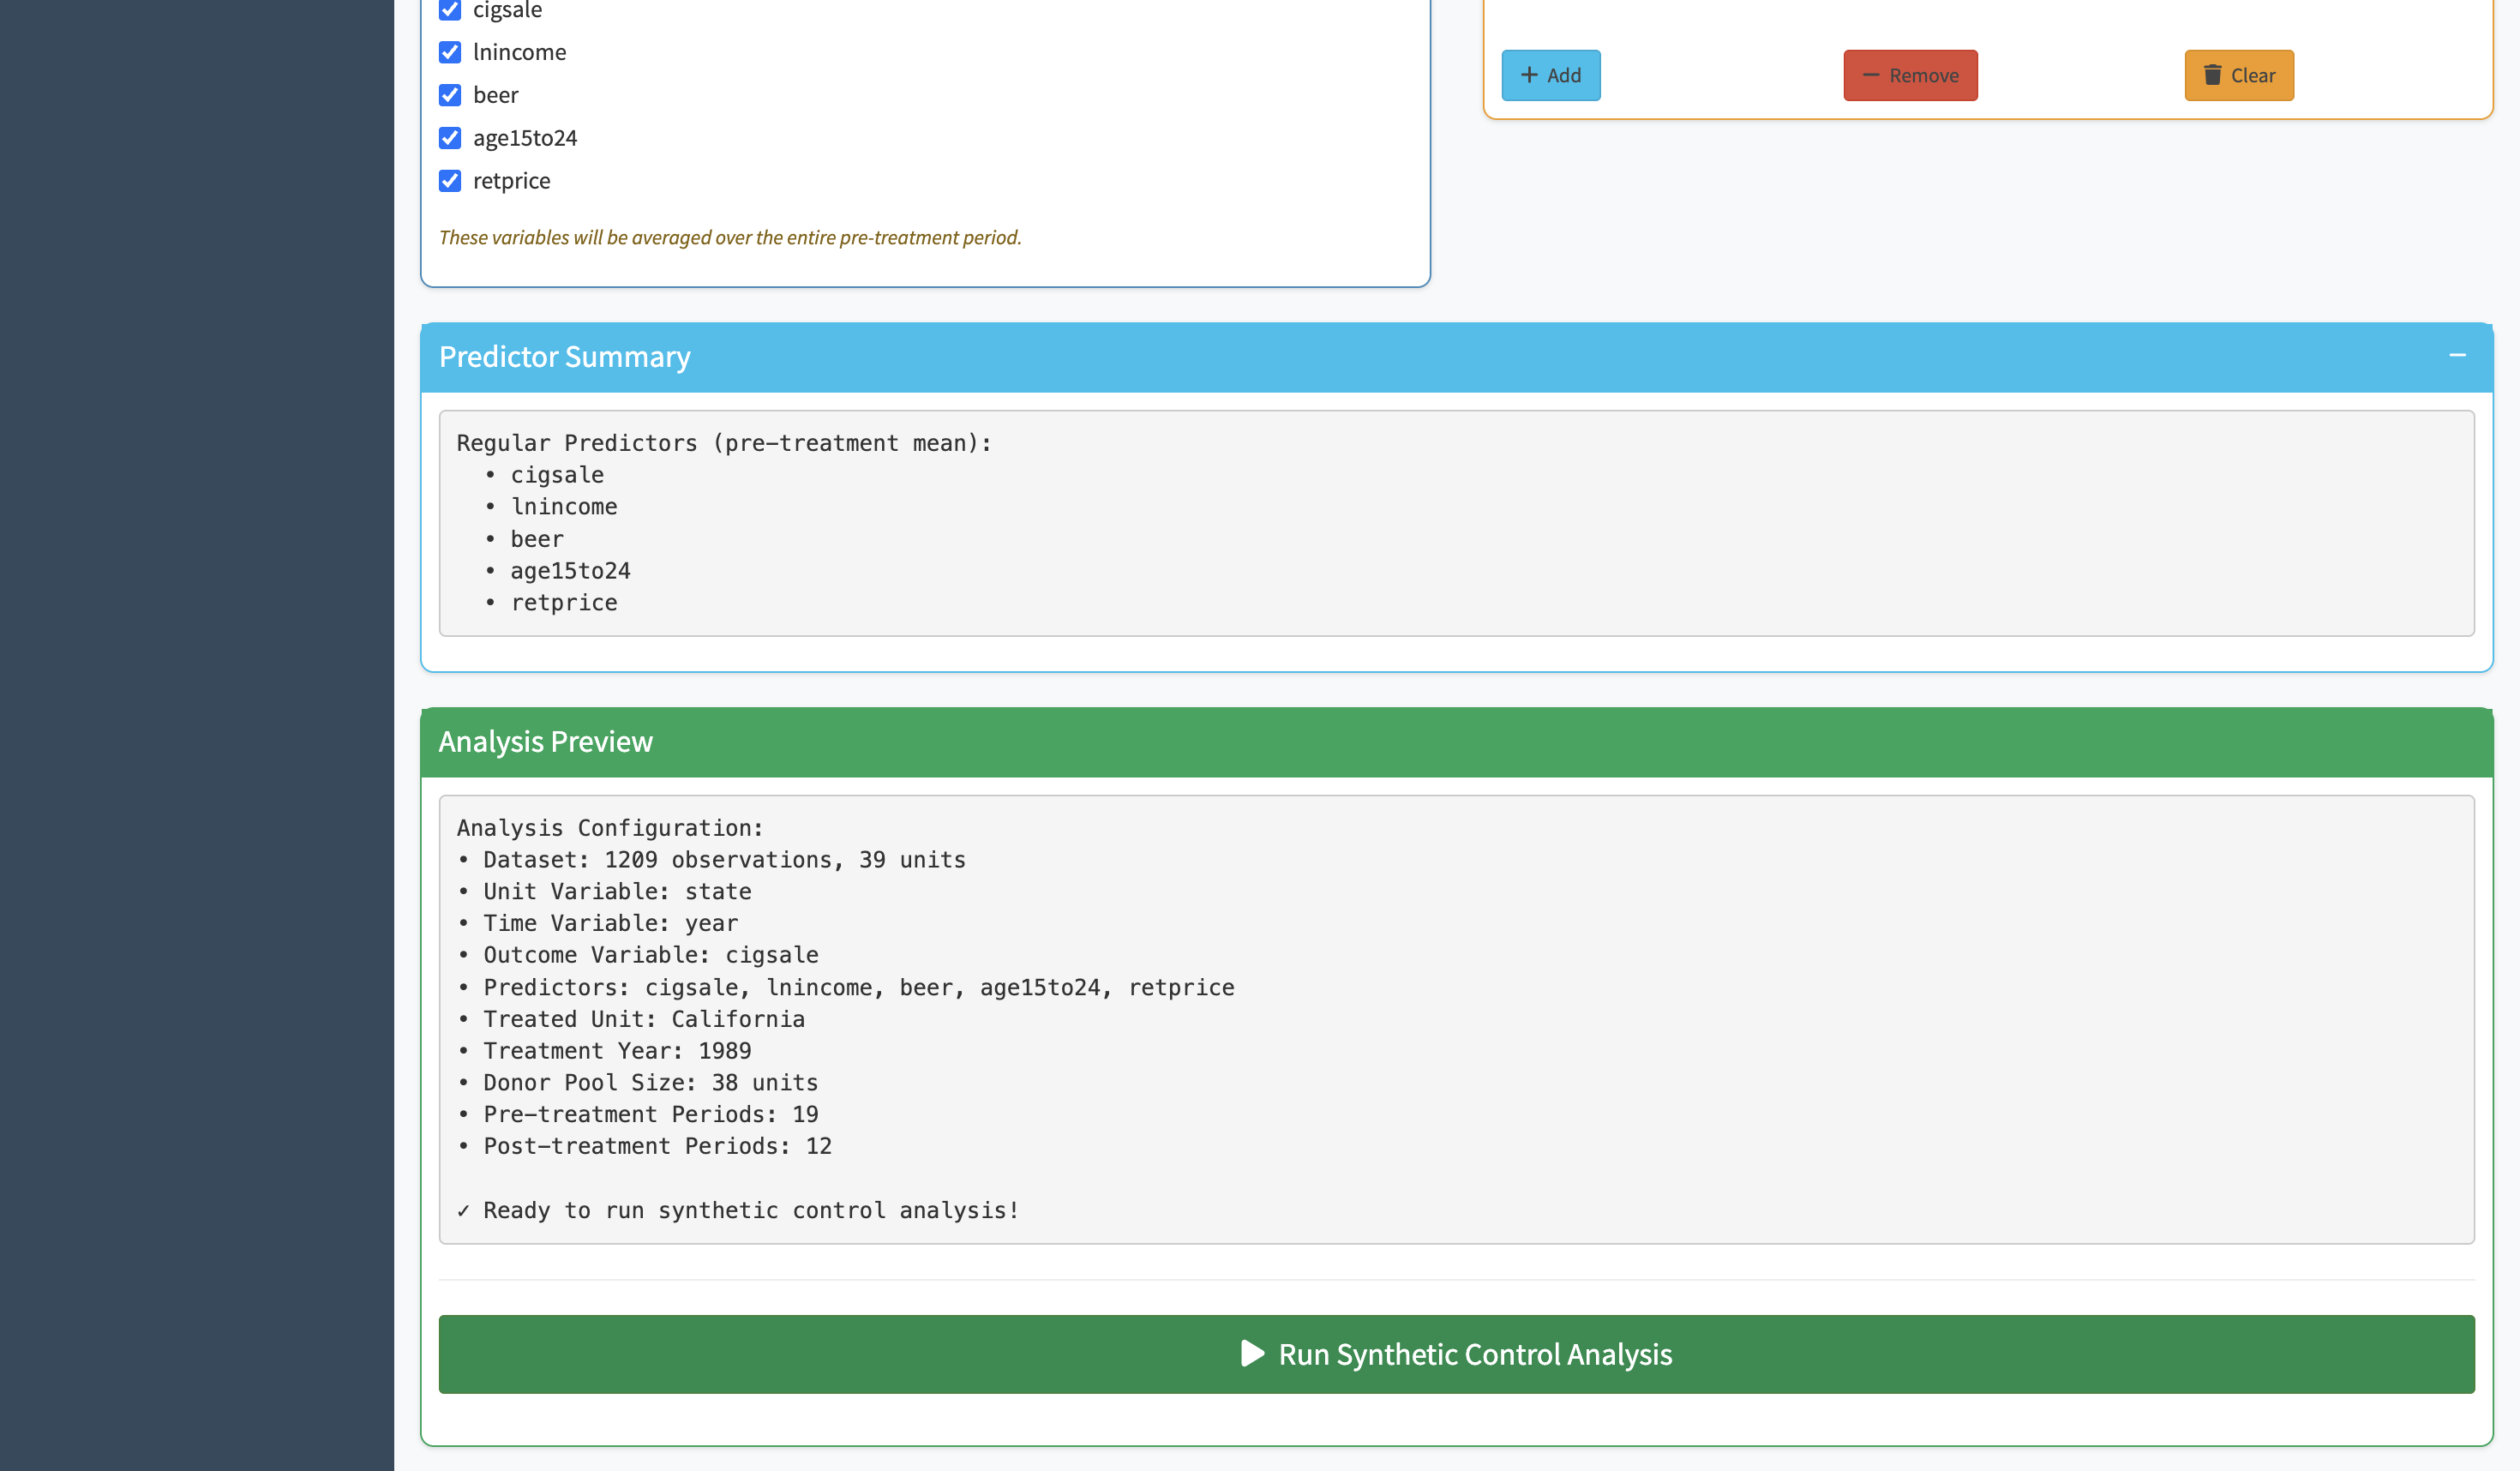
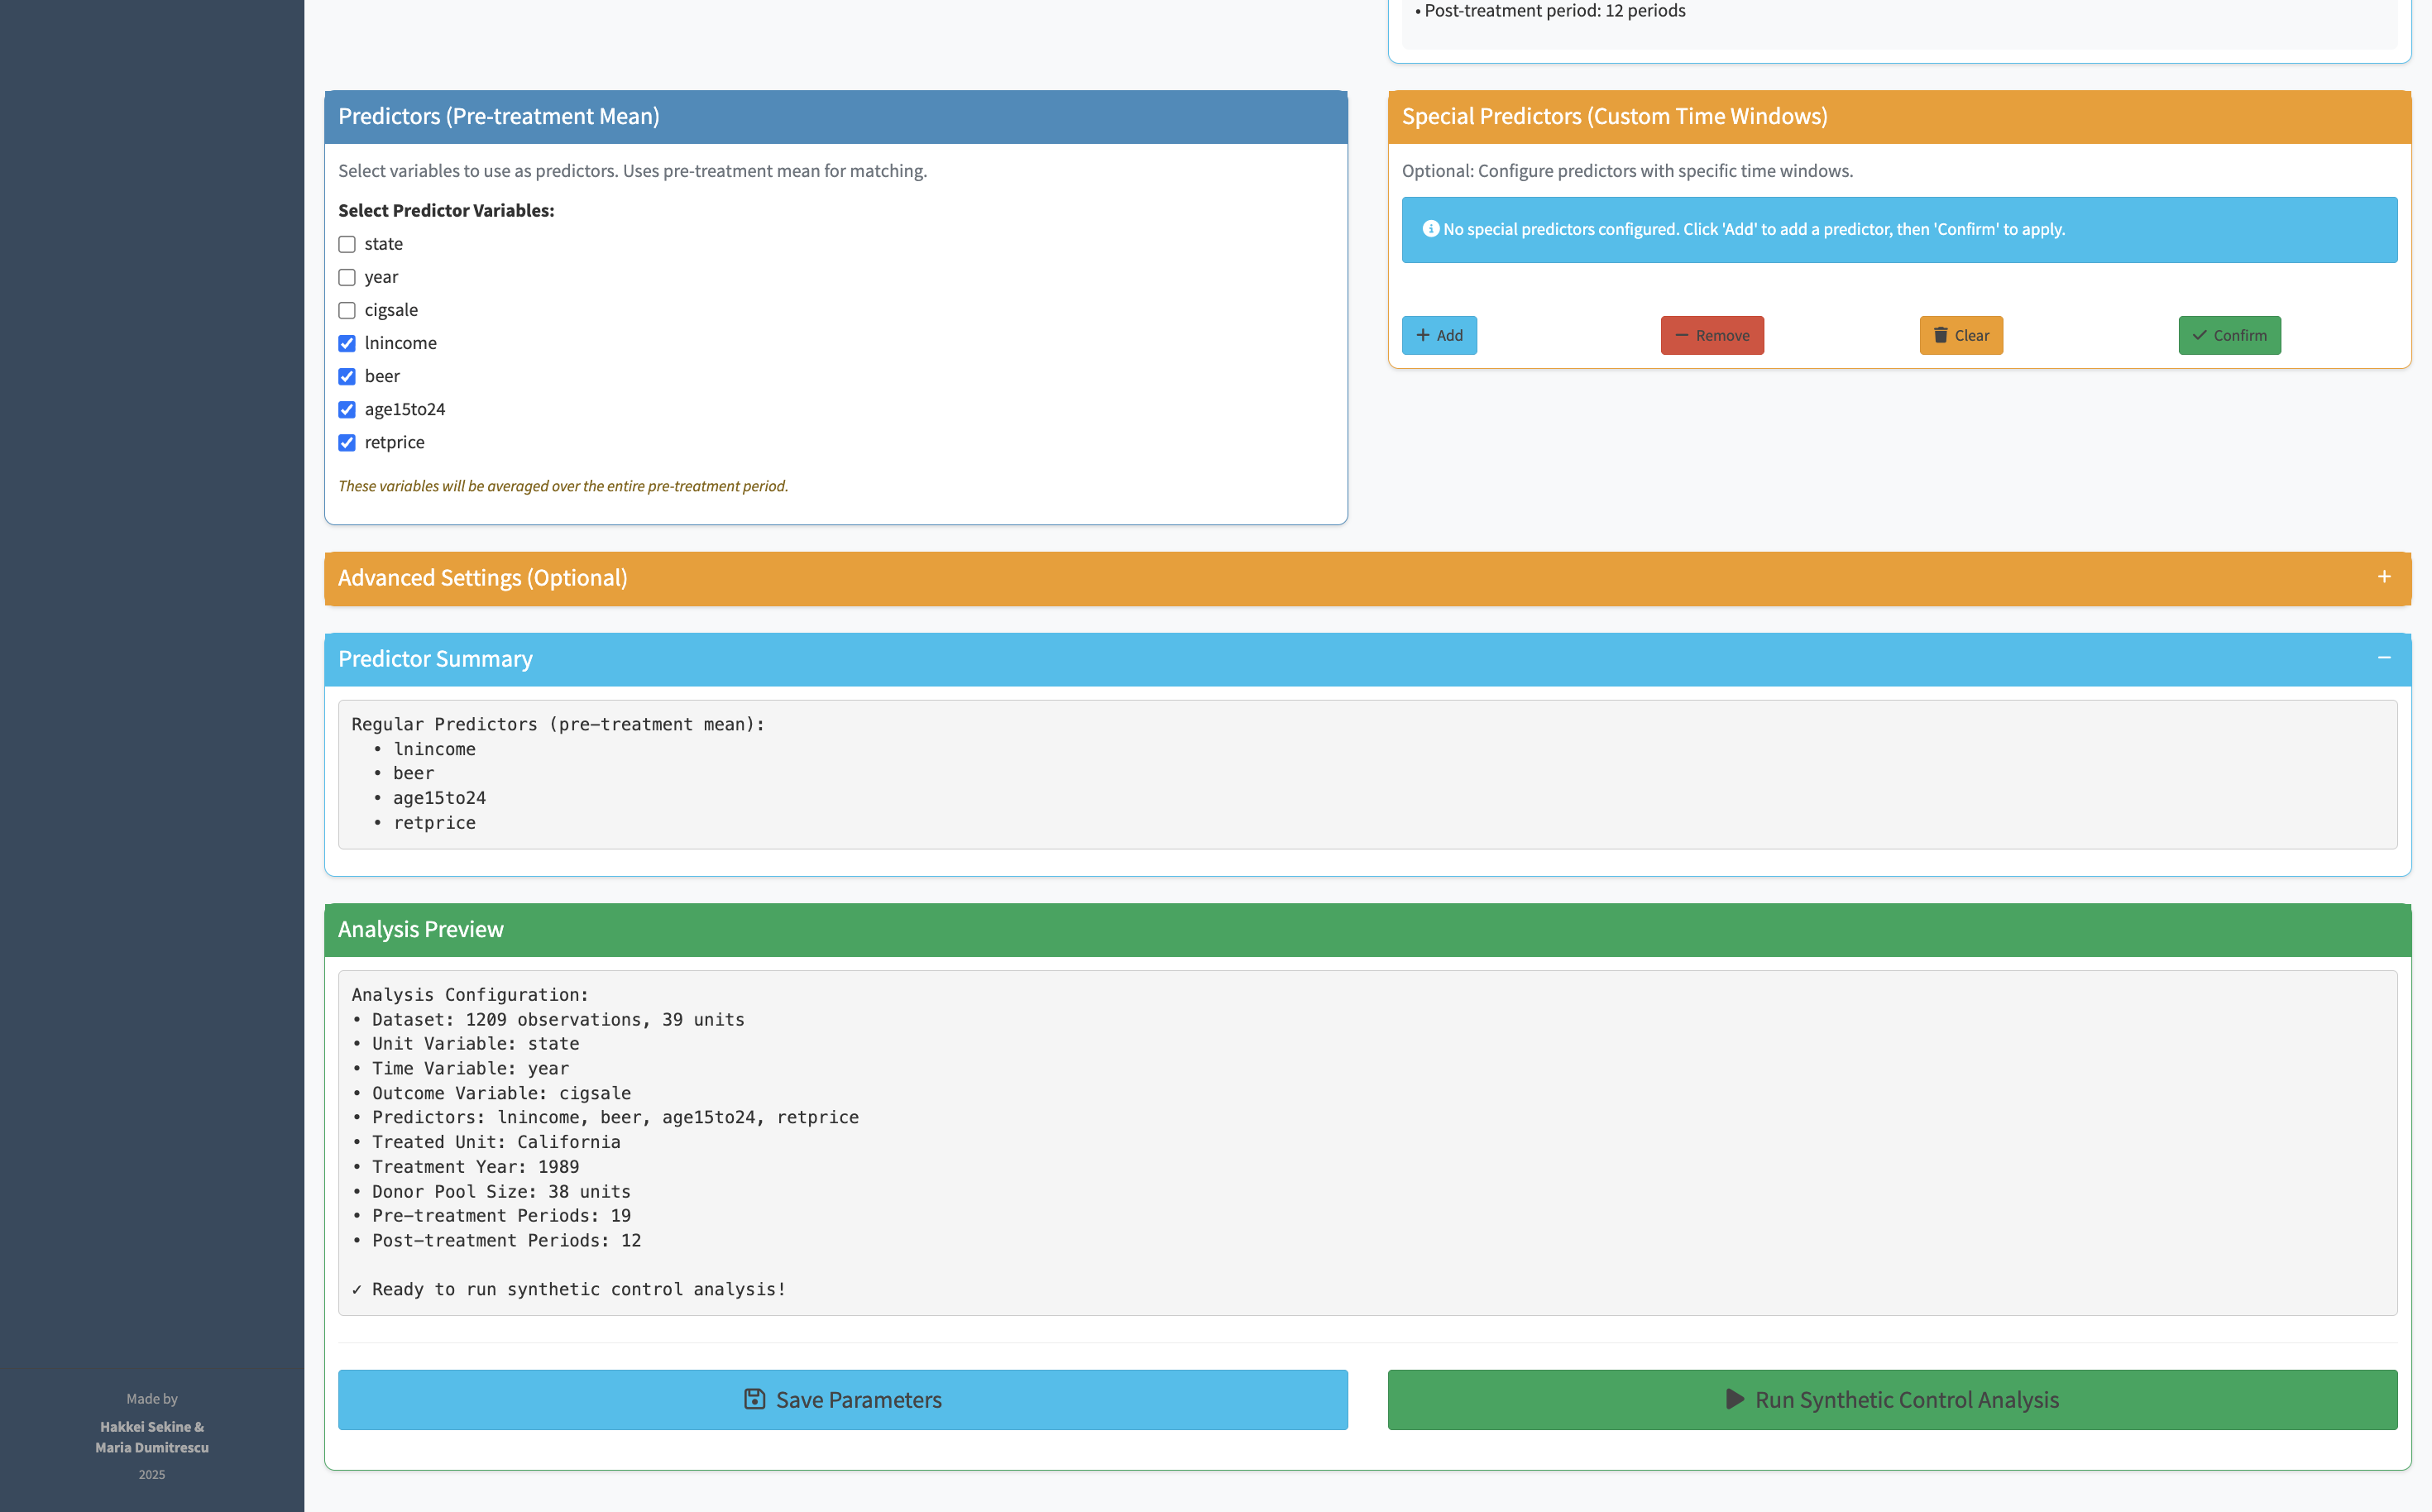
The hardest part of running a synthetic control in R is getting the function call right — specifying the treatment unit, the time of intervention, the outcome variable, the predictors, and the donor pool in exactly the right format. Synth replaces all of that with a set of clearly labeled dropdowns. You pick your variables, the app builds the function call in the background.
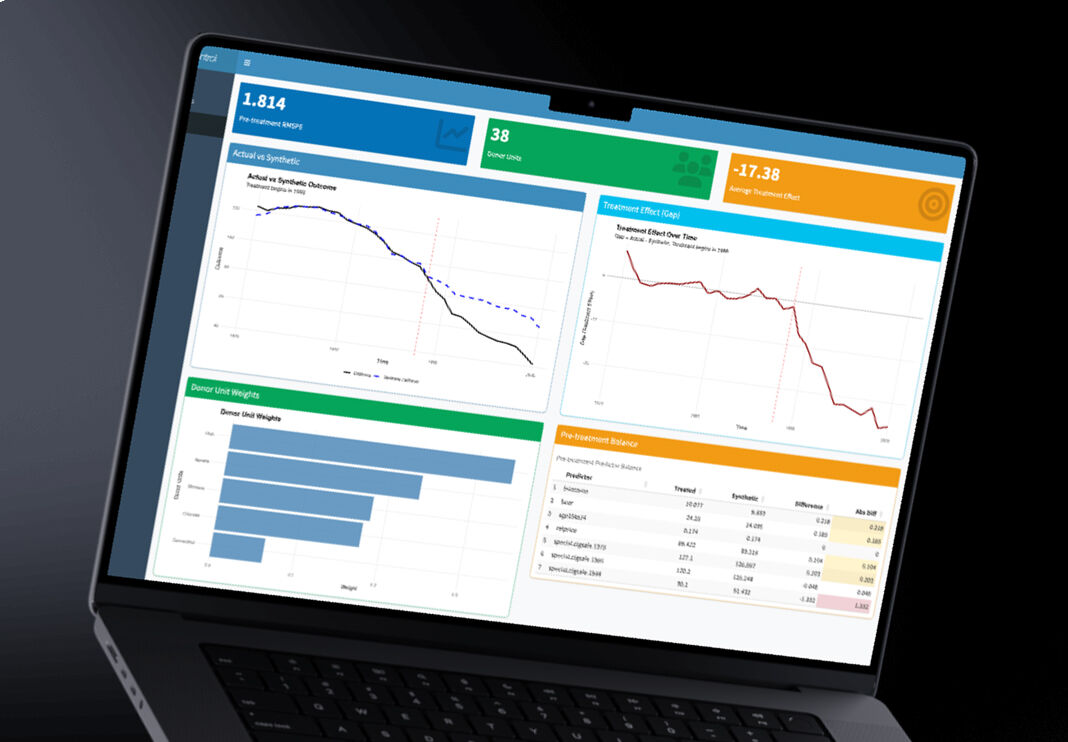
Once parameters are set, a single button runs the full synthetic control algorithm. The output is a time-series chart overlaying the real treated unit with its synthetic counterpart. The pre-intervention period shows how well the synthetic control matches the real unit — if the lines are close, the counterfactual is credible. The post-intervention gap is the effect estimate.
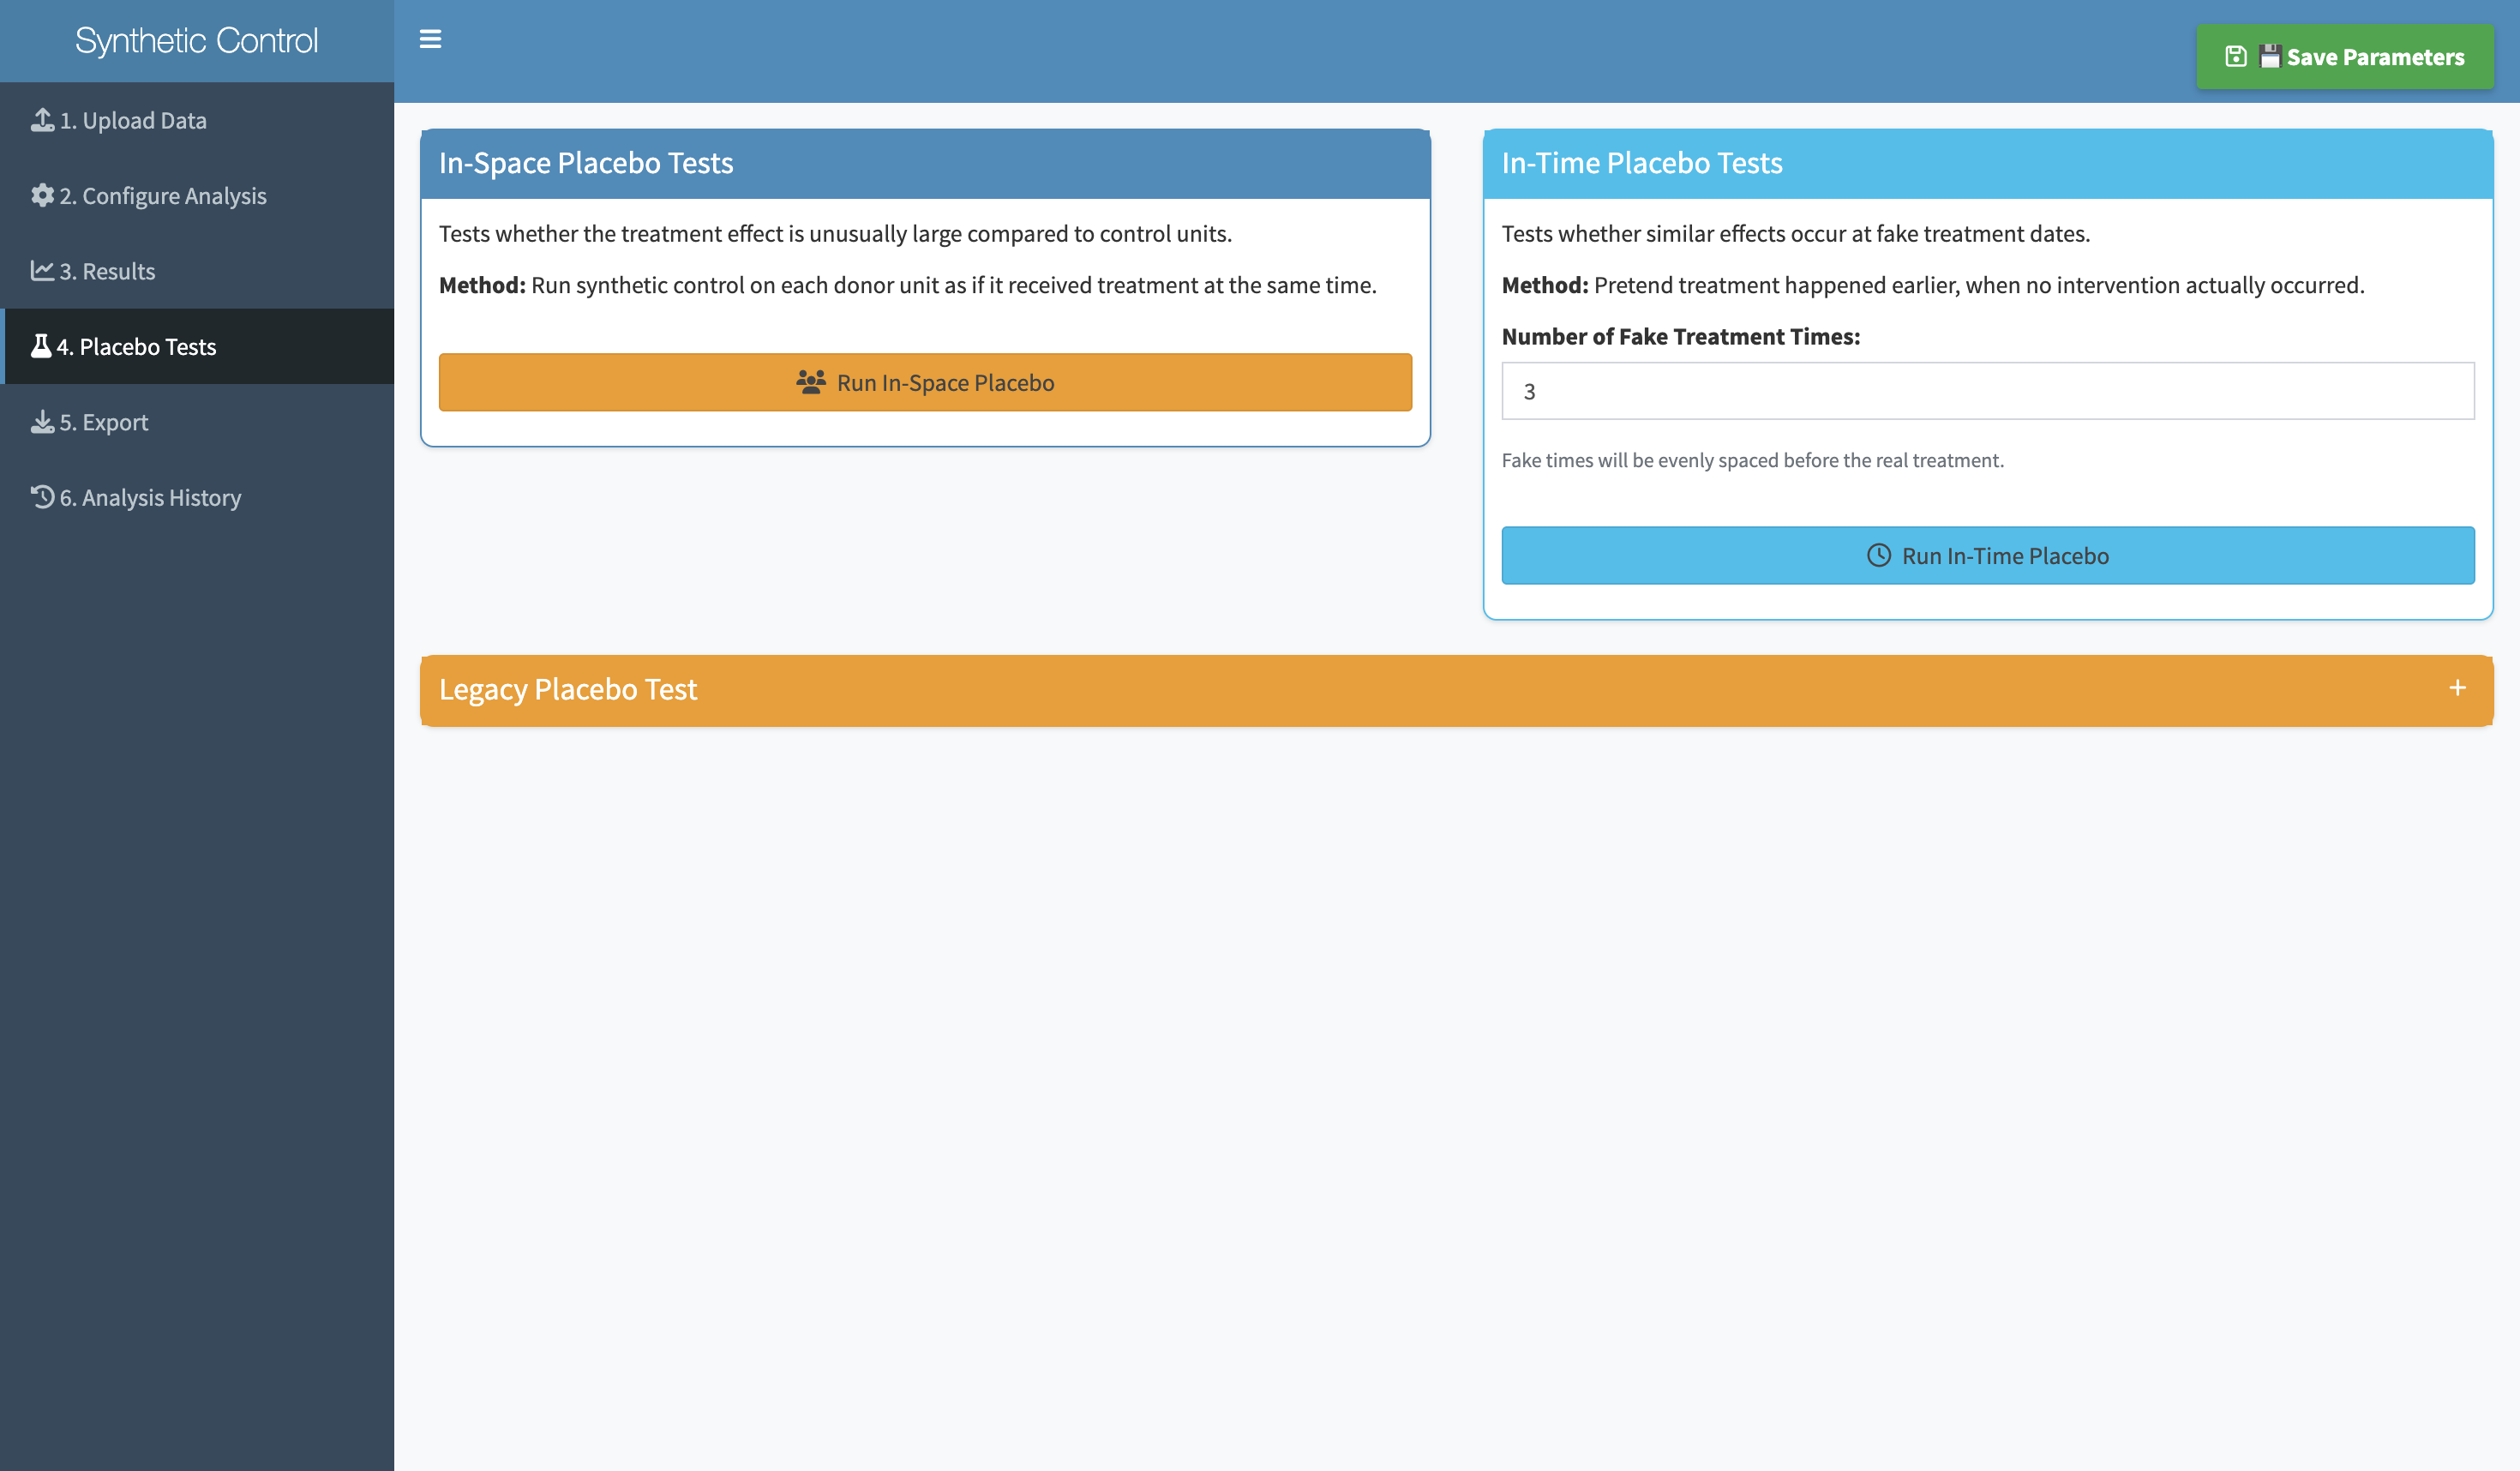
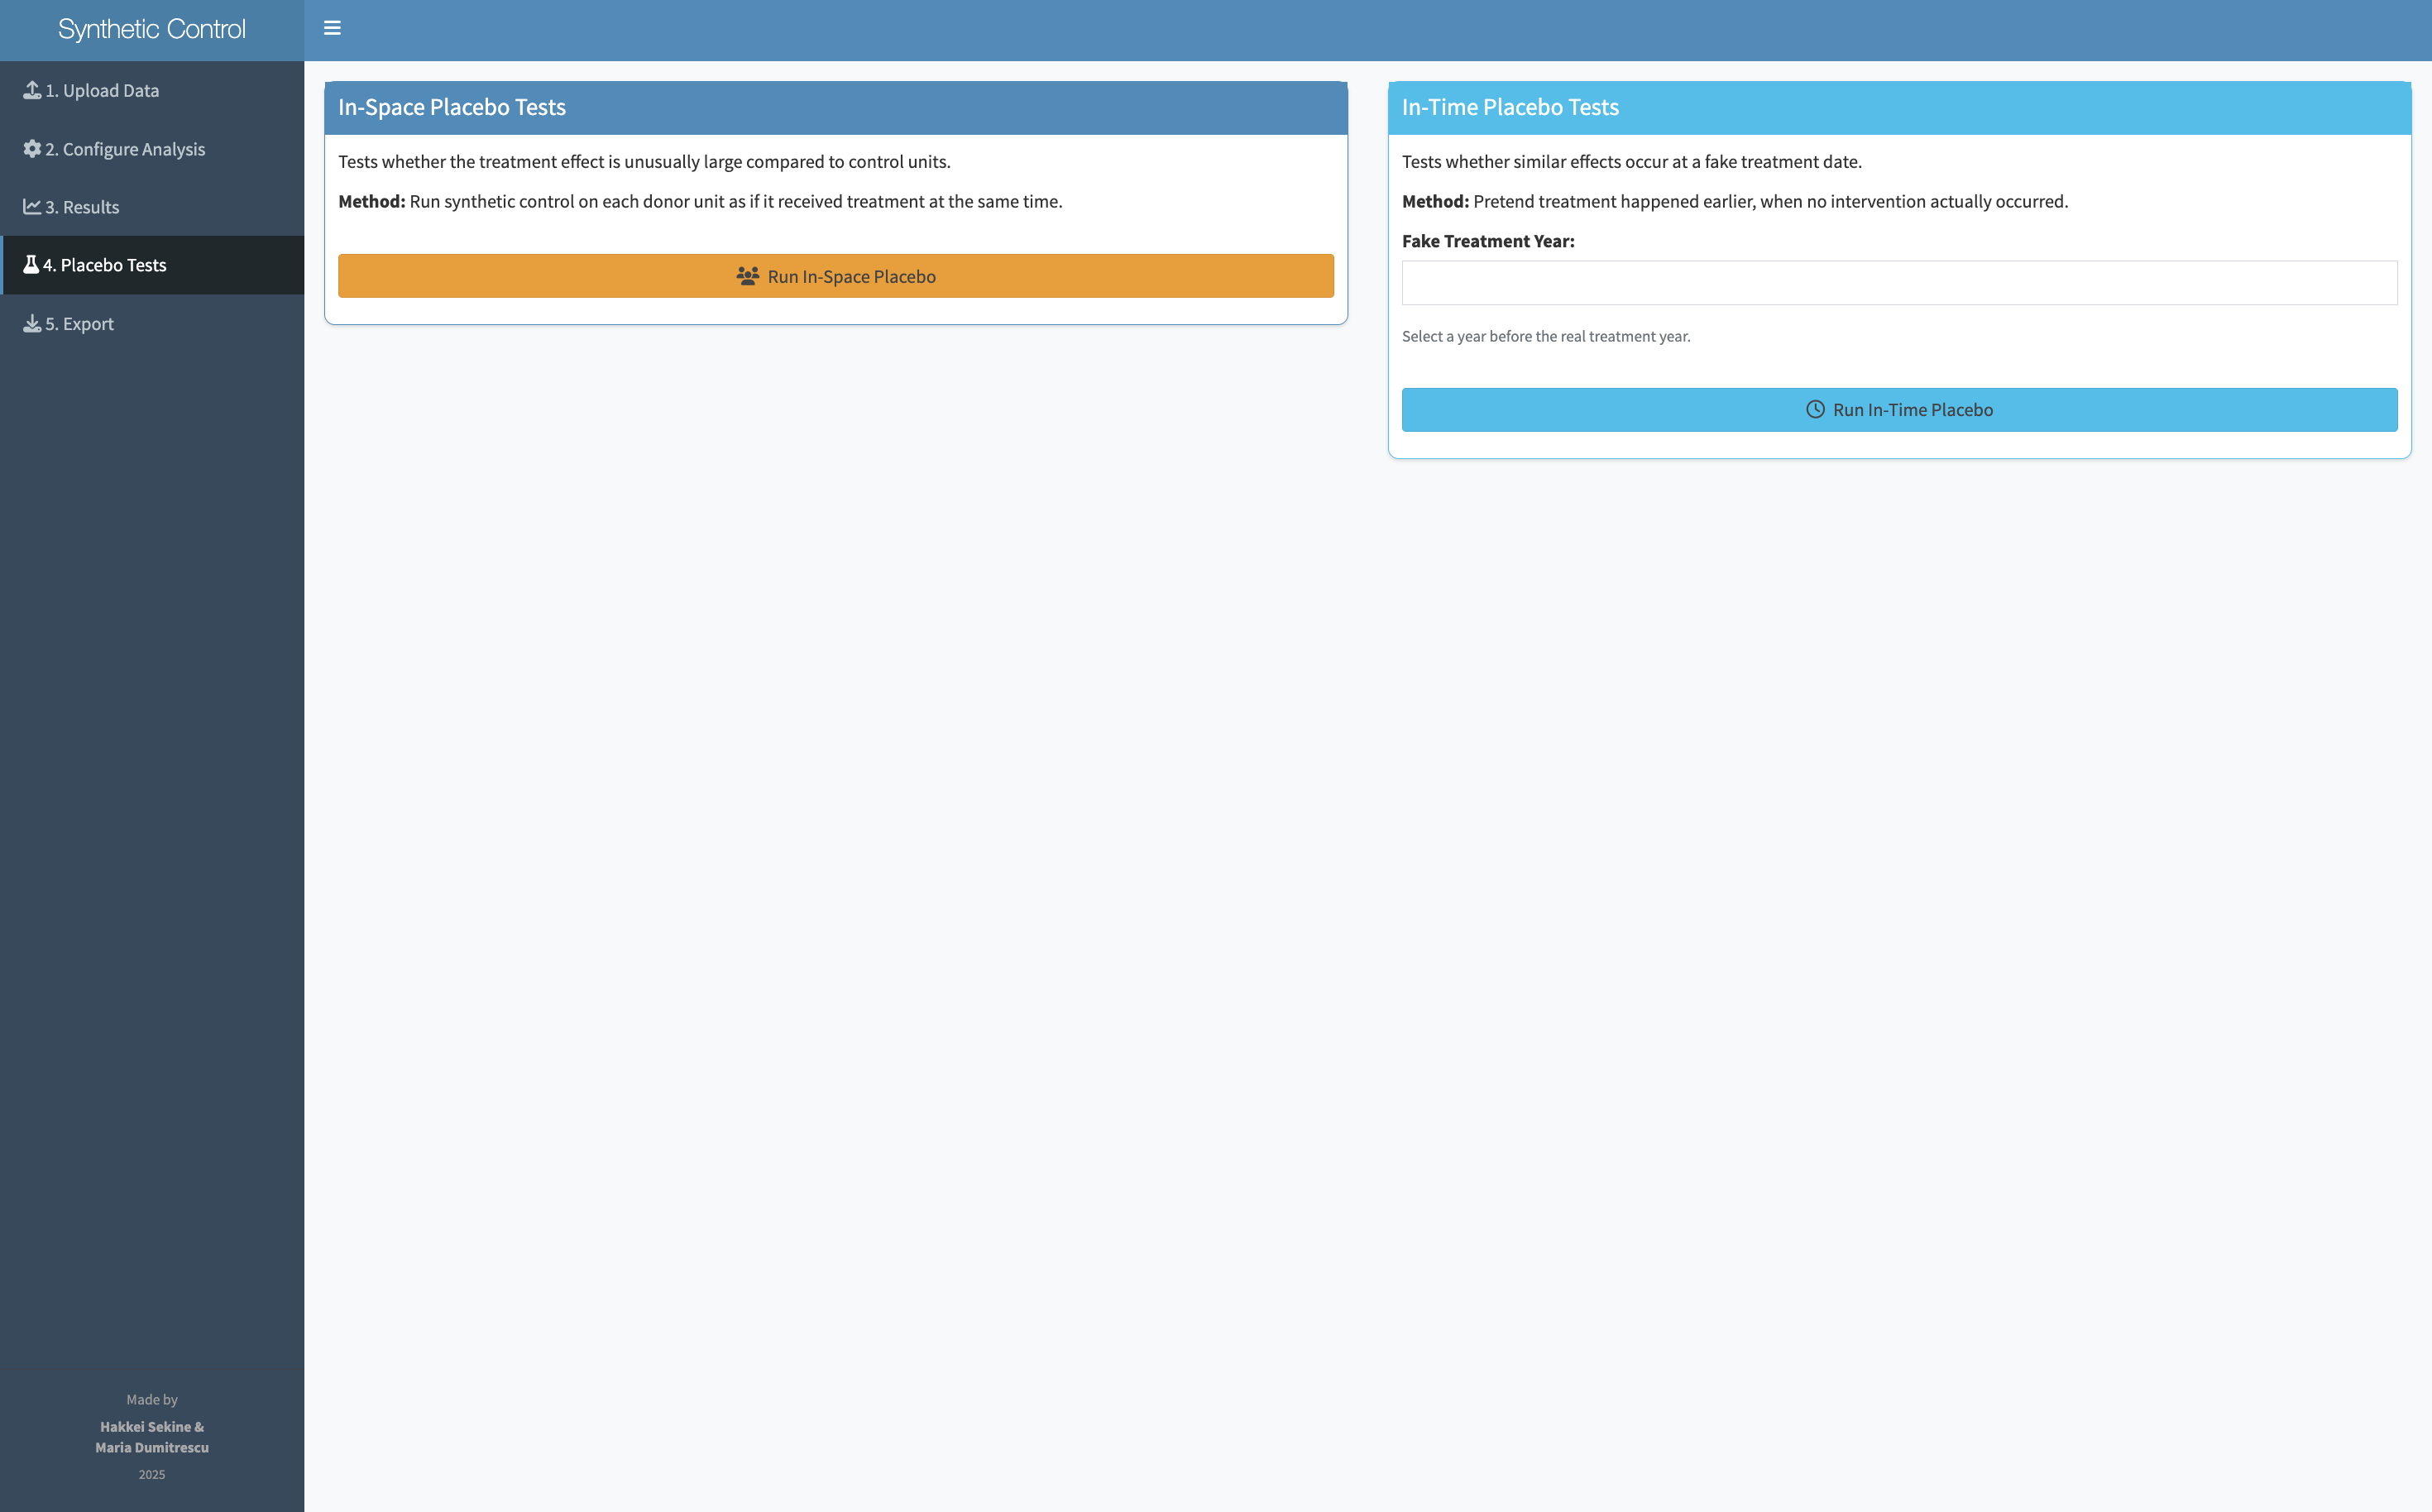
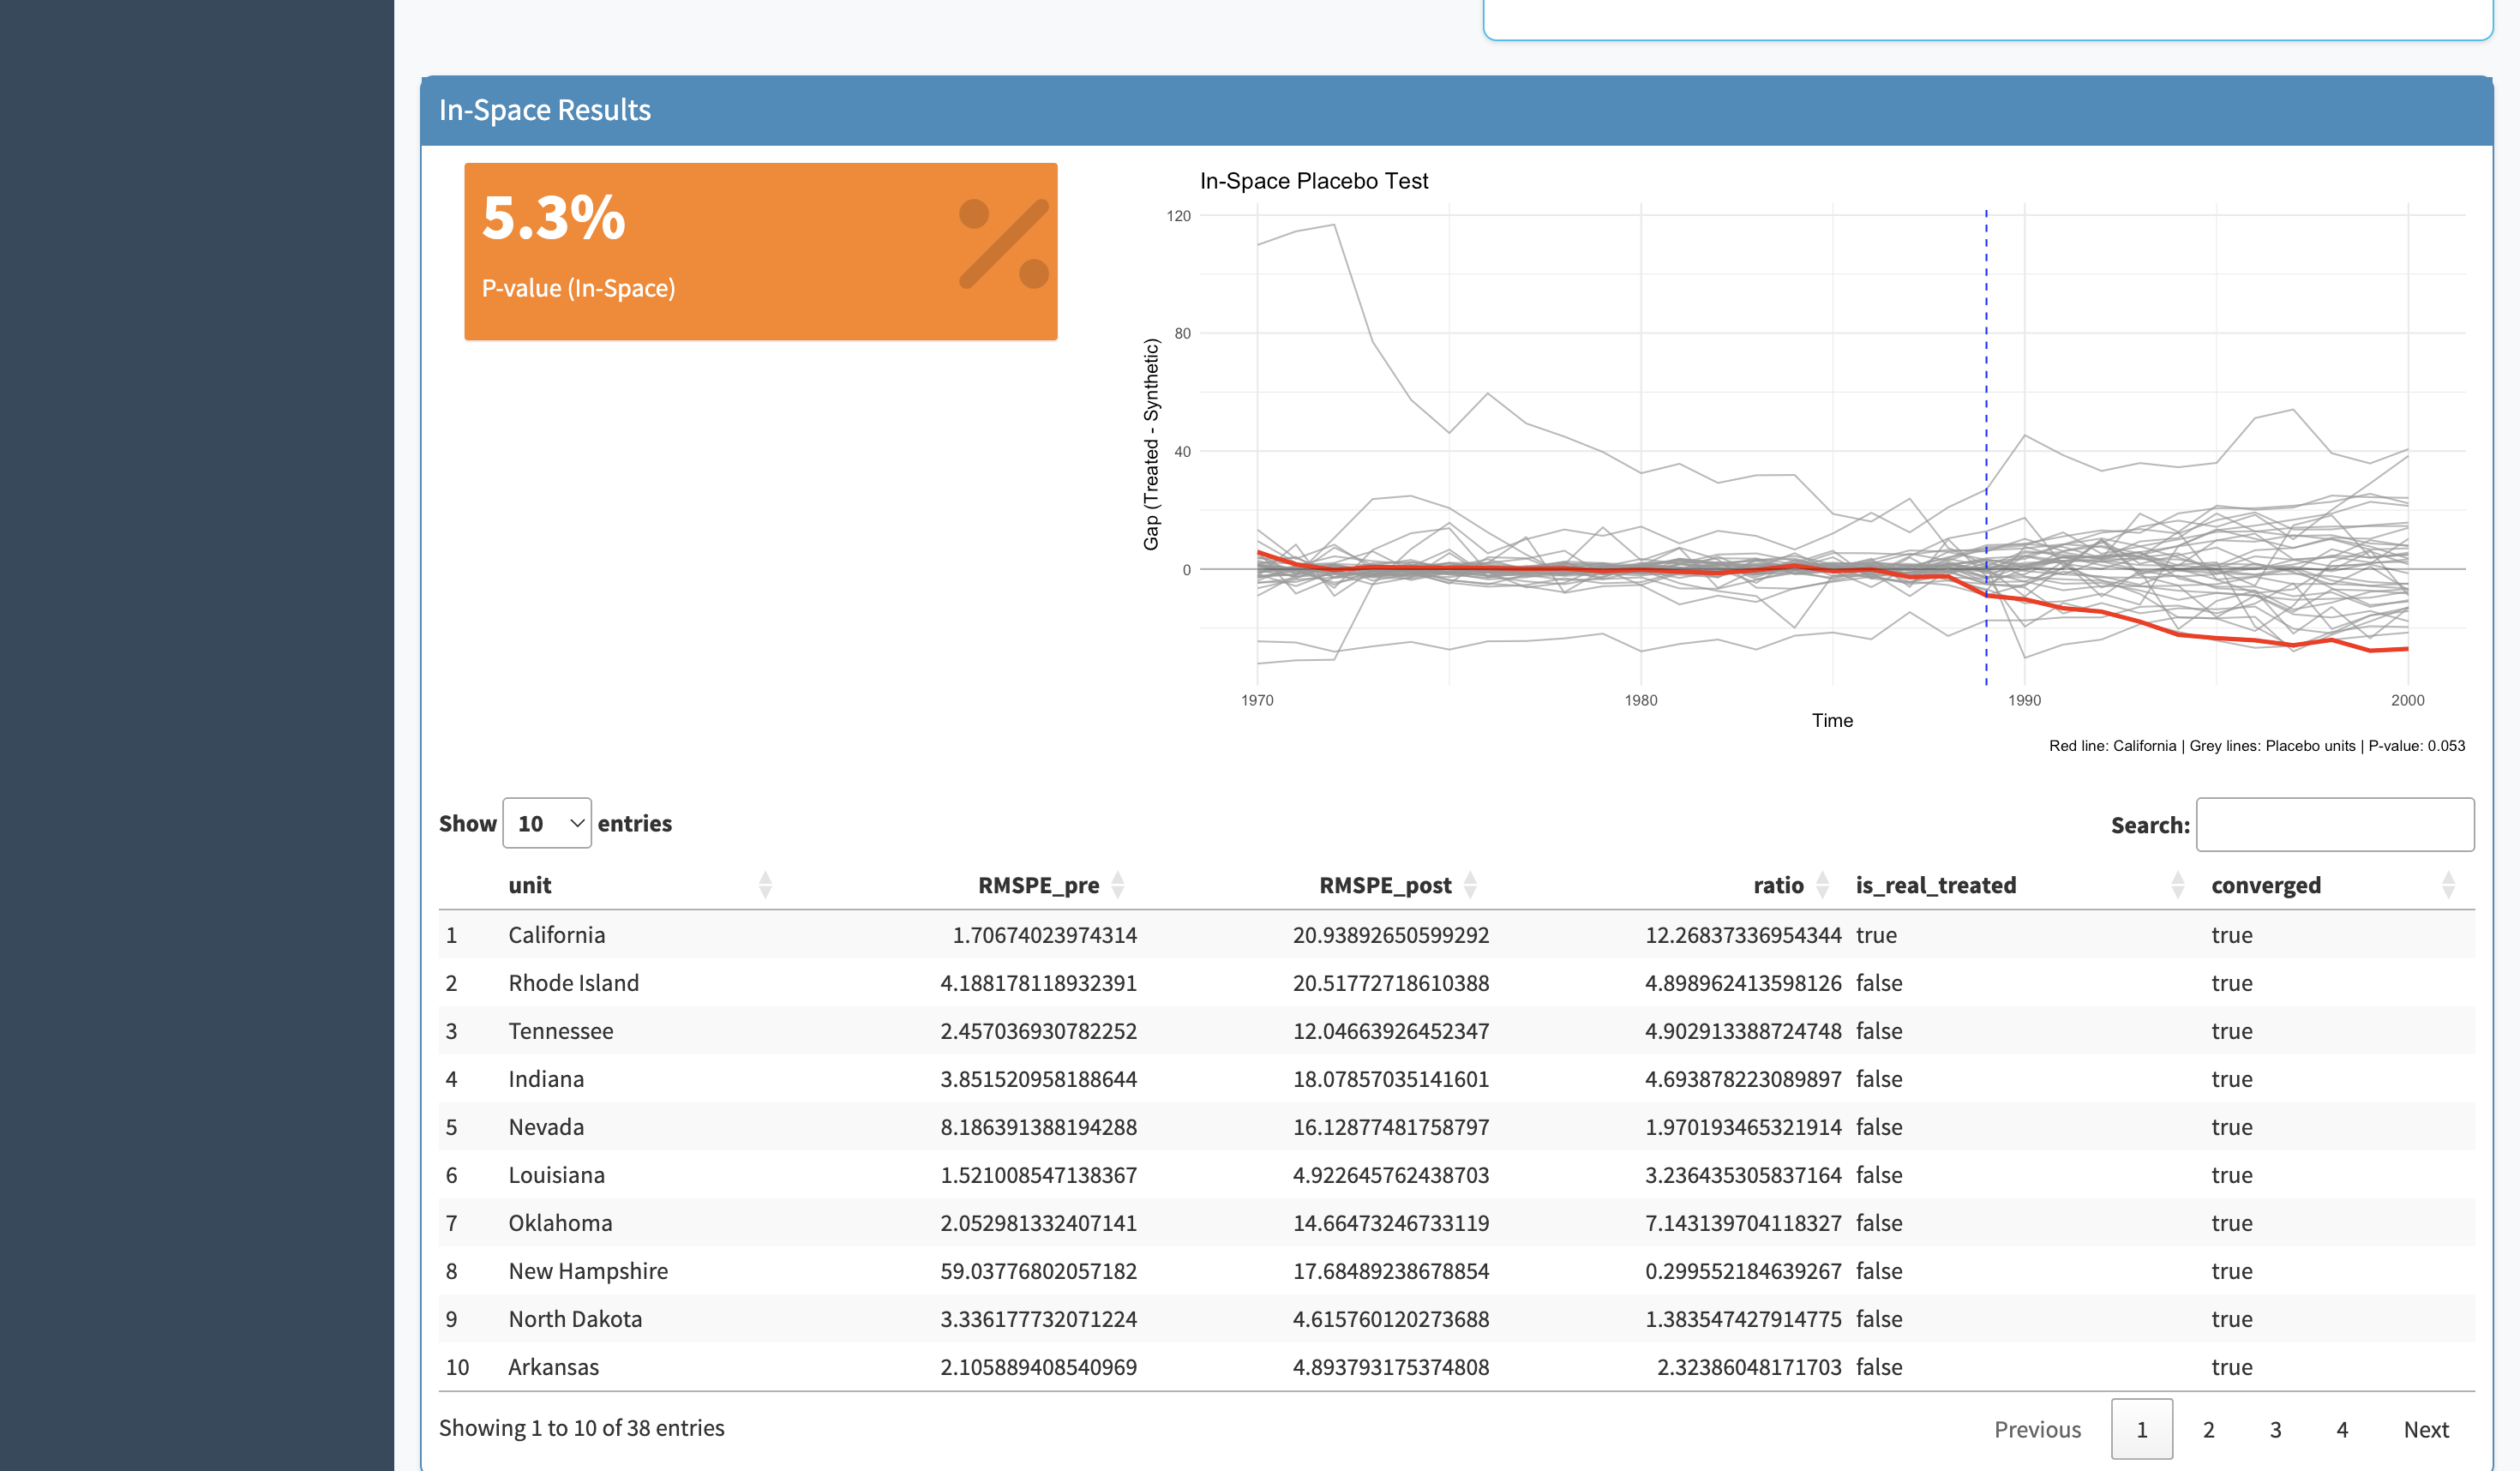
A synthetic control result only means something if it's unusual compared to what you'd find by chance. Placebo tests run the same analysis on every other unit in the dataset — states or countries that weren't actually treated. If the real finding is genuine, the treated unit's gap should be substantially larger than any of the placebos. If it looks similar to the placebos, the result is unreliable.
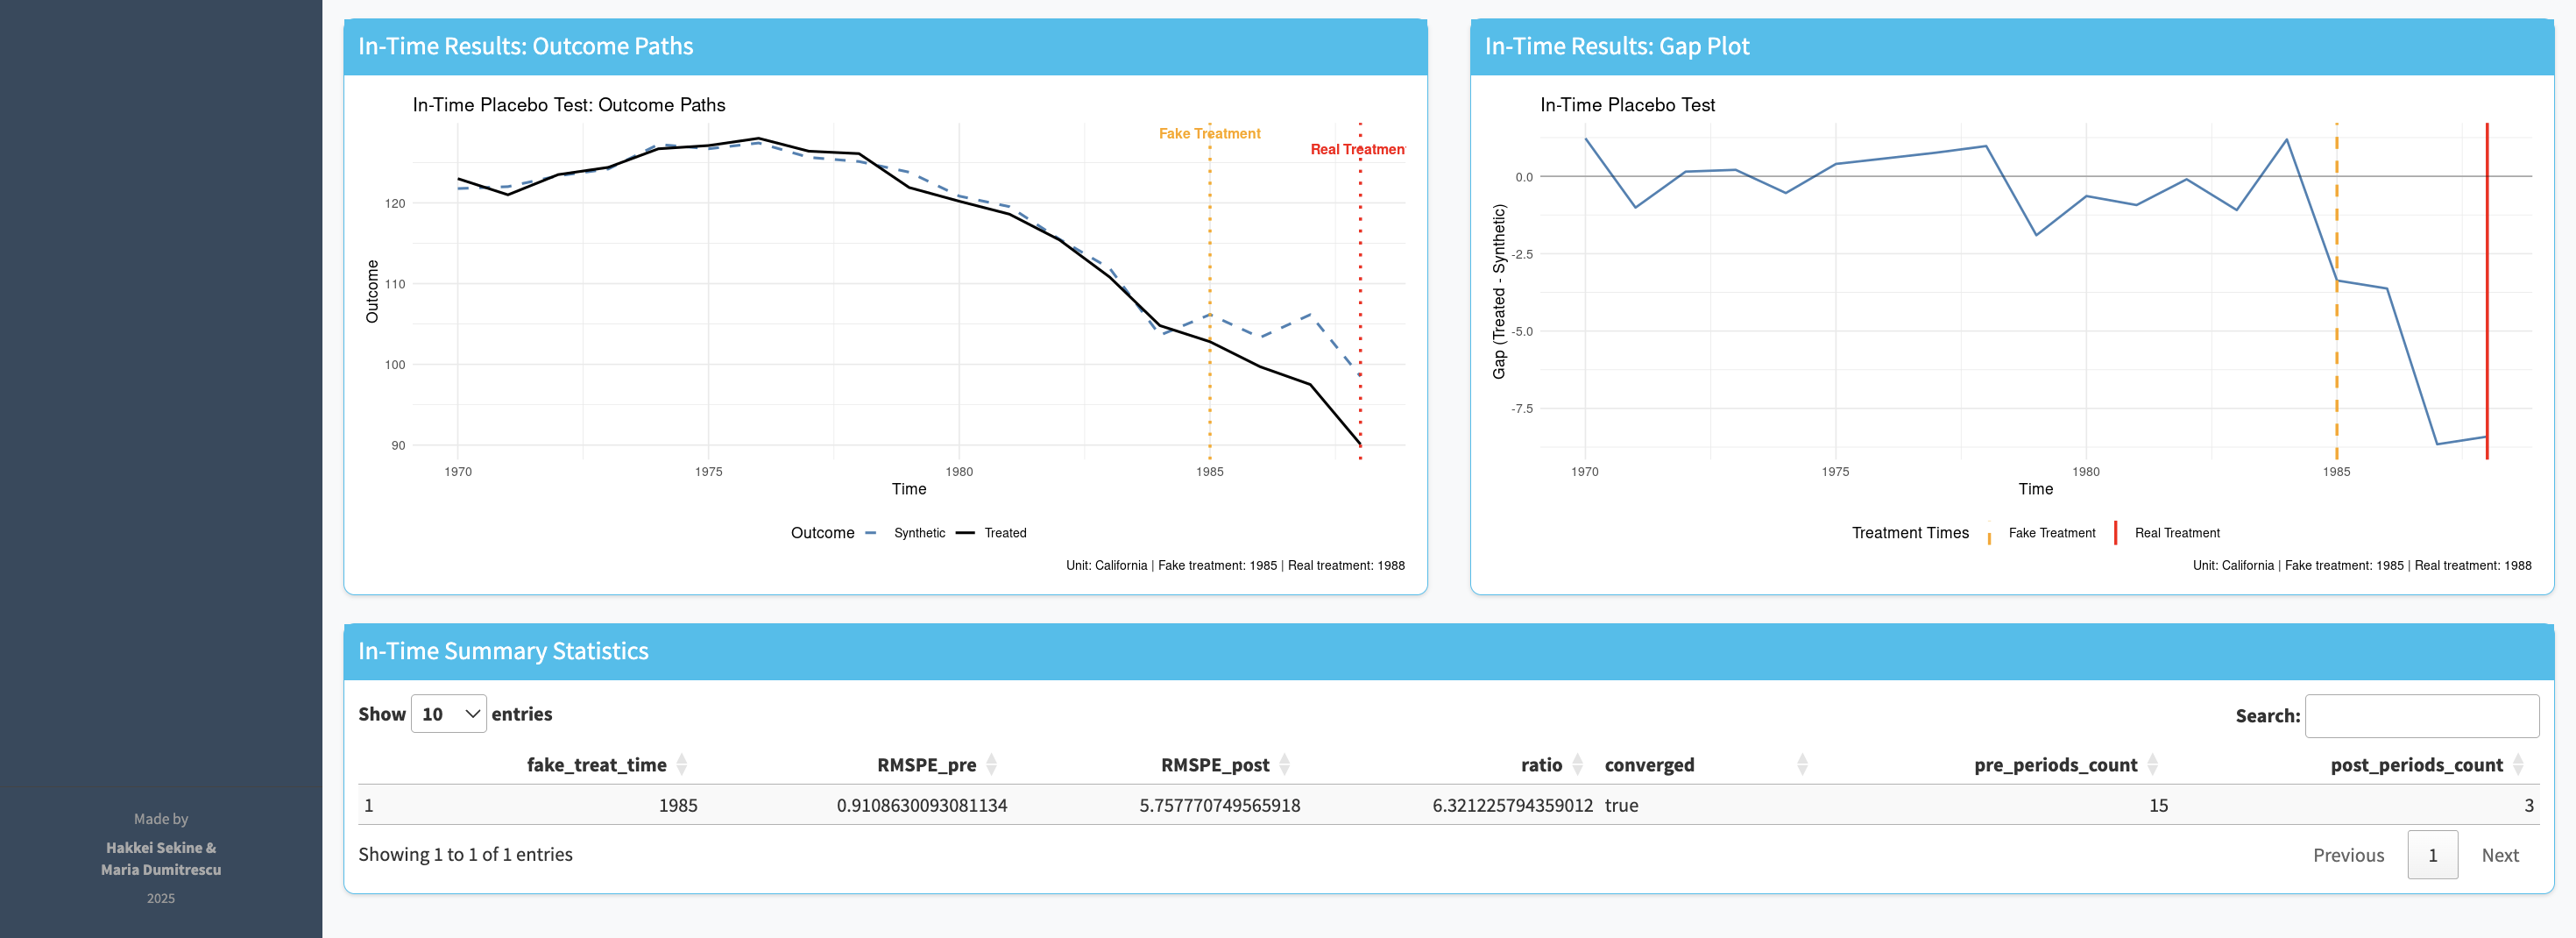
Synth runs both types of placebo test: in time (apply the intervention date to the pre-intervention period — if you still see an effect, your result is spurious) and in space (apply the method to each donor unit — your unit's gap should stand out).
.png)
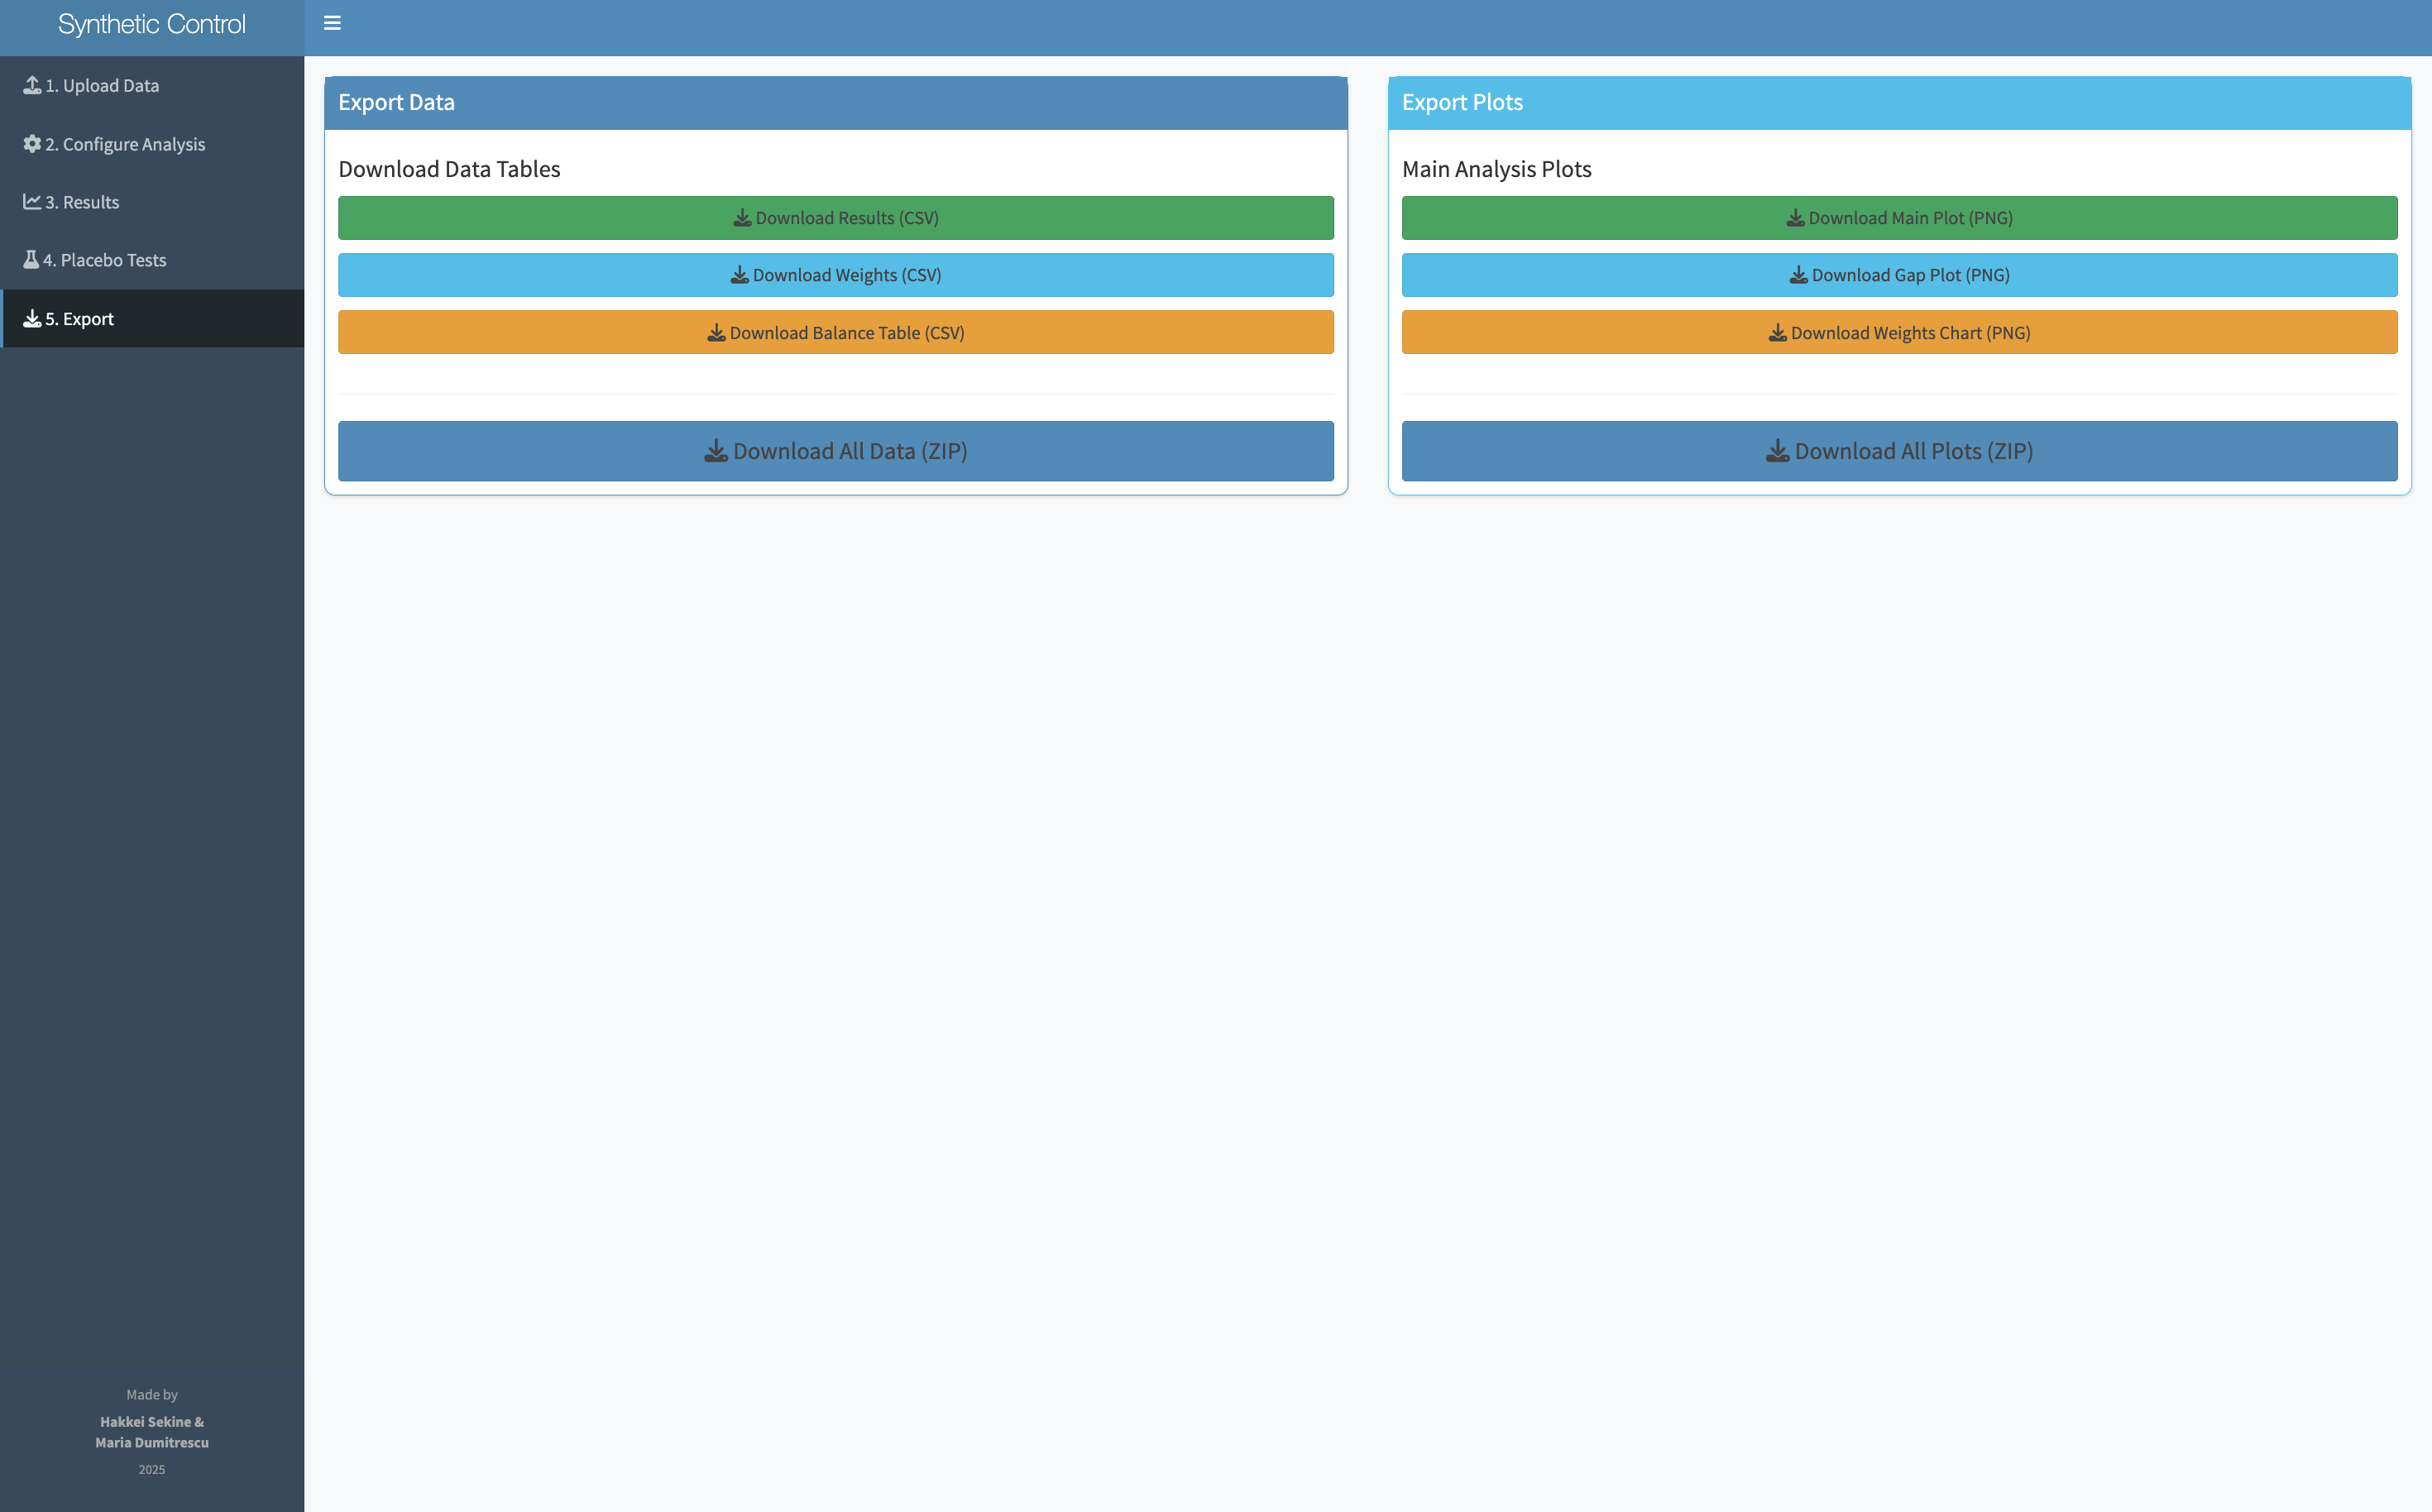
Synth exports what researchers actually need: the donor weights (which units were used to construct the synthetic counterpart, and how much weight each received), the placebo test plots, and the full results table. The exports are formatted to drop directly into an academic paper appendix.
.png)
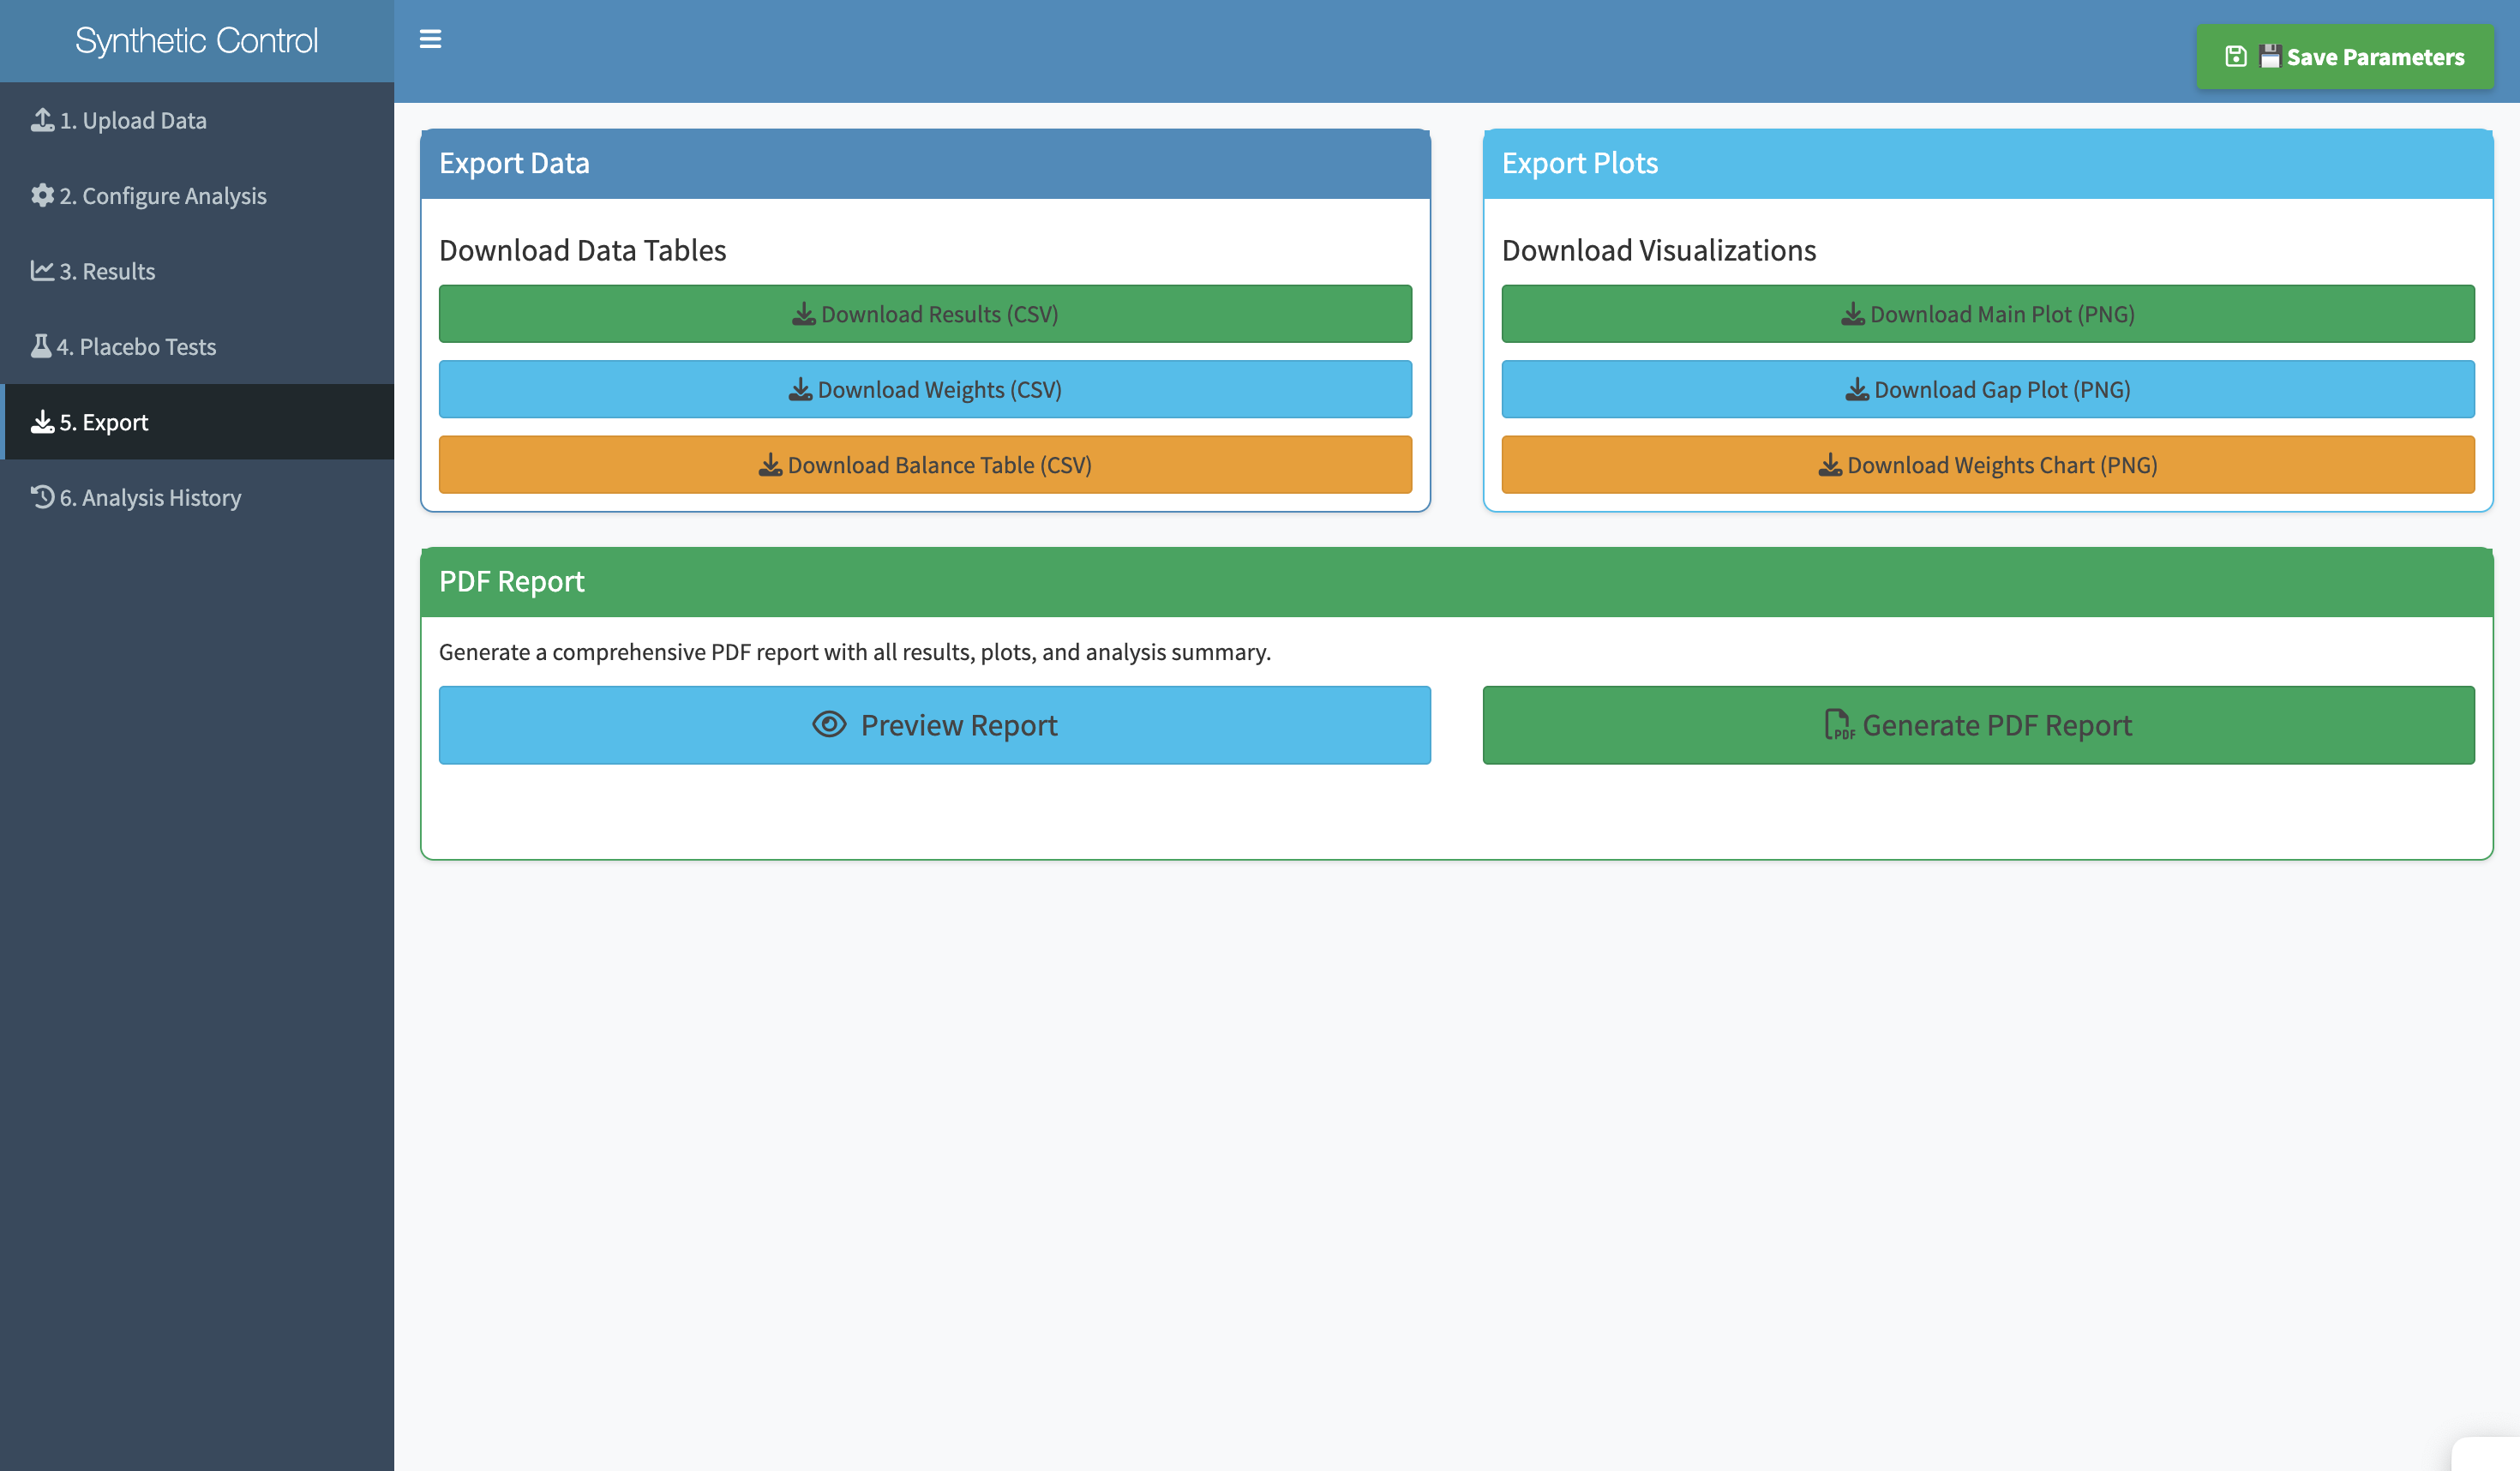
Synth doesn't just produce a chart — it produces a defensible research finding. The combination of the primary analysis, the in-time and in-space placebo tests, and the donor weight table gives researchers everything they need to include a synthetic control analysis in a paper, a report, or a presentation.
The main chart is legible to anyone who's seen a time-series plot. Pre-intervention alignment shows the model is credible; post-intervention gap shows the effect.
Both in-time and in-space placebo tests are available in-app, not as separate analyses requiring additional code. Run them in two clicks after the primary analysis.
Donor weight tables, parameter logs, and charts are formatted for academic papers and policy reports — not just for internal analysis.
The biggest design challenge wasn't making the interface look clean — it was deciding what comes first. If you ask researchers to specify the donor pool before they understand what a donor pool is, you've already lost them. Getting the order right meant thinking about what each step builds on, not just what information the algorithm needs.
A statistical method that lives only in a paper or a package reaches only the people who can read the paper or run the package. Designing access is as important as designing accuracy.
Policy researchers are deeply expert in their domain and completely non-expert in R. Designing for that split — domain expertise plus tool inexperience — requires very different decisions than designing for general audiences.
Placebo tests are what separate a credible synthetic control from a spurious one. Putting them in the same interface as the analysis — not as an optional extra — changed the tool from a convenience into a research partner.
"The most interesting design constraint wasn't the interface — it was the researcher. They know everything about their data and nothing about the algorithm. The tool had to be fluent in both languages: the language of causal inference and the language of 'I just need to answer this question about my policy.'"